
 Submit an article

Articles
- Page Path
- HOME > J Korean Acad Nurs > Volume 56(3); 2026 > Article
-
Research Paper
임상적 악화 상황에서 간호사의 상황인식 측정도구 개발: 방법론적 연구 -
강혜진1
 , 하이경2,3
 - Development of a nurses’ situation awareness scale for clinical deterioration: a methodological study
-
Hye Jin Kang1, Yi Kyung Ha2,3
-
Journal of Korean Academy of Nursing 2026;56(3):370-381.
DOI: https://doi.org/10.4040/jkan.26039
Published online: August 5, 2026
1마산대학교 간호학과
2동의대학교 간호학과
3동의대학교 동의간호과학연구소
1Department of Nursing, Masan University, Masan, South Korea
2Department of Nursing, Dong-eui University, Busan, South Korea
3Research Institute of Dong-eui Nursing Science, Dong-eui University, Busan, South Korea
- Corresponding author: Yi Kyung Ha Department of Nursing, Dong-eui University, 176 Eomgwang-ro, Busanjin-gu, Busan 47340, South Korea E-mail: yikyung.ha@deu.ac.kr
- †This manuscript is based on a part of the first author's doctoral dissertation from Dong-eui University (2026).
• Received: March 16, 2026 • Revised: April 21, 2026 • Accepted: June 17, 2026
© 2026 Korean Society of Nursing Science
This is an Open Access article distributed under the terms of the Creative Commons Attribution NoDerivs License (http://creativecommons.org/licenses/by-nd/4.0) If the original work is properly cited and retained without any modification or reproduction, it can be used and re-distributed in any format and medium.
- 1,003 Views
- 120 Download


Abstract
-
Purpose
- This study aimed to develop a scale for assessing nurses’ situation awareness of clinical deterioration and to evaluate its validity and reliability.
-
Methods
- This methodological study followed the scale-development guidelines of DeVellis and Thorpe. Item generation began with 44 items derived from 17 attributes identified through a hybrid-model concept analysis, which included a literature review and focus group interviews with 13 nursing experts. After content validity was evaluated by seven experts, 30 items were retained. A pilot test was then conducted with 20 hospital nurses to assess item comprehensibility. From August 30 to October 6, 2025, a total of 446 hospital nurses participated in the survey, and data from 440 respondents were analyzed. Construct validity was examined using exploratory and confirmatory factor analyses, along with convergent and discriminant validity testing. Internal consistency was evaluated using Cronbach’s α and McDonald’s ω.
-
Results
- Exploratory factor analysis yielded a three-factor model, which showed acceptable fit in confirmatory factor analysis. The final instrument comprised 24 items across three factors, was scored on a 5-point Likert scale, and was named the Nurses’ Situation Awareness Scale for Clinical Deterioration (NSAS-CD). The scale showed high internal consistency, with Cronbach’s α of .98 and McDonald’s ω of .98.
-
Conclusion
- The NSAS-CD demonstrated acceptable validity and reliability for assessing nurses’ situation awareness of clinical deterioration. Further research is needed to evaluate its generalizability across diverse clinical settings and to establish standardized criteria for clinical deterioration.
서론
방법
1) 도구 개발
(1) 개념적 기틀 및 구성요소 확인
(2) 예비문항 개발 및 척도 결정
(3) 예비문항의 내용타당도 검증 및 문항 검토
(4) 예비조사
2) 도구 검증
(1) 연구대상
(2) 자료수집
(3) 자료분석
가. 구성타당도
ⅰ. 탐색적 요인분석
ⅱ. 확인적 요인분석
ⅲ. 수렴타당도와 판별타당도 검증
나. 신뢰도 검증
결과
1) 문항 분석
2) 탐색적 요인분석
3) 확인적 요인분석
4) 수렴타당도와 판별타당도
고찰
결론
-
Conflicts of Interest
No potential conflict of interest relevant to this article was reported.
-
Acknowledgements
None.
-
Funding
This research received no external funding.
-
Data Sharing Statement
Please contact the corresponding author for data availability.
-
Supplementary Data
Supplementary data to this article can be found online at https://doi.org/10.4040/jkan.26039.
Supplementary Table 1.
jkan-26039-Supplementary-Table-1.pdf
Supplementary Table 2.
jkan-26039-Supplementary-Table-2.pdf
Supplementary Table 3.
jkan-26039-Supplementary-Table-3.pdf
Supplementary Material 1.
-
Author Contributions
Conceptualization: HJK, YKH. Methodology: HJK, YKH. Software: HJK, YKH. Validation: HJK, YKH. Formal analysis: HJK, YKH. Investigation: HJK. Resources: HJK, YKH. Data curation: HJK, YKH. Visualization: YKH. Supervision: YKH. Project administration: YKH. Funding acquisition: none. Writing–original draft: HJK, YKH. Writing–review & editing: HJK, YKH. Final approval of the manuscript: all authors.
Article Information
Fig. 1.Results of the confirmatory factor analysis. All estimates are standardized. Standardized factor loadings are shown on the single-headed arrows, and correlations between latent variables are shown on the curved double-headed arrows. e1–e24 denote measurement errors associated with the observed variables included in the final confirmatory factor analysis (items 1–5, 9–16, 18–24, 26–27, and 29–30). a)Factor 1: prediction and preparedness. b)Factor 2: cue capture. c)Factor 3: situation appraisal.
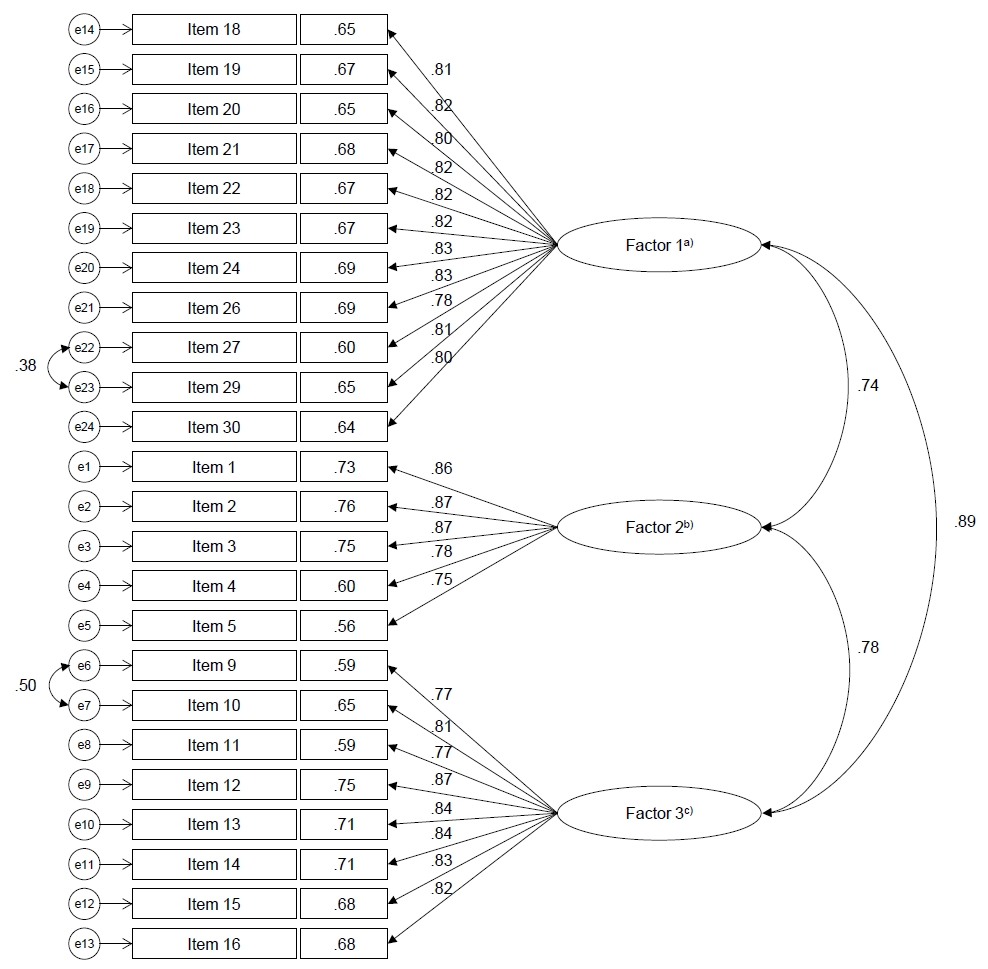
Table 1.General characteristics of participants (N=440)
Table 2.Factor loadings, item communalities, and eigenvalues from exploratory factor analysis (24 items) (N=220)
Table 3.Convergent validity based on confirmatory factor analysis (N=220)
Table 4.Discriminant validity based on the Fornell-Larcker criterion (N=220)
| Factors | SMC (φ2) | AVE | ||
|---|---|---|---|---|
| 1a) | 2b) | 3c) | ||
| 1a) | 1 | .66 | ||
| 2b) | .55 (<.001) | 1 | .68 | |
| 3c) | .79 (<.001) | .61 (<.001) | 1 | .67 |
Table 5.Discriminant validity based on confidence intervals of inter-factor correlations (φ±2SE) (N=220)
| Factor | Correlation (φ) | SE | φ–2SE | φ+2SE |
|---|---|---|---|---|
| 1a) ↔ 2b) | .74 (<.001) | 0.03 | 0.68 | 0.80 |
| 1a) ↔ 3c) | .89 (<.001) | 0.02 | 0.85 | 0.93 |
| 2b) ↔ 3c) | .78 (<.001) | 0.03 | 0.72 | 0.84 |
- 1. Endsley MR. Toward a theory of situation awareness in dynamic systems. Hum Factors. 1995;37(1):32-64. https://doi.org/10.1518/001872095779049543Article
- 2. Endsley MR. Situation awareness misconceptions and misunderstandings. J Cogn Eng Decis Mak. 2015;9(1):4-32. https://doi.org/10.1177/1555343415572631Article
- 3. Ghaderi C, Esmaeili R, Ebadi A. Situation awareness in intensive care unit nurses: a qualitative directed content analysis. Front Public Health. 2022;10:999745. https://doi.org/10.3389/fpubh.2022.999745ArticlePubMedPMC
- 4. Sitterding MC, Broome ME, Everett LQ, Ebright P. Understanding situation awareness in nursing work: a hybrid concept analysis. ANS Adv Nurs Sci. 2012;35(1):77-92. https://doi.org/10.1097/ANS.0b013e3182450158ArticlePubMed
- 5. Jones D, Mitchell I, Hillman K, Story D. Defining clinical deterioration. Resuscitation. 2013;84(8):1029-1034. https://doi.org/10.1016/j.resuscitation.2013.01.013ArticlePubMed
- 6. Gonem S, Draicchio D, Mohamed A, Wood S, Shiel K, Briggs S, et al. Physiological deterioration prior to in-hospital cardiac arrest: what does the National Early Warning Score-2 miss? Resusc Plus. 2024;20:100788. https://doi.org/10.1016/j.resplu.2024.100788ArticlePubMedPMC
- 7. Lyons PG, Reid J, Richardville S, Edelson DP. A novel structured debriefing program for consensus determinations of in-hospital cardiac arrest predictability and preventability. Resuscitation. 2024;197:110161. https://doi.org/10.1016/j.resuscitation.2024.110161ArticlePubMed
- 8. Chan PS, Greif R, Anderson T, Atiq H, Bittencourt Couto T, Considine J, et al. Ten steps toward improving in-hospital cardiac arrest quality of care and outcomes. Resuscitation. 2023;193:109996. https://doi.org/10.1016/j.resuscitation.2023.109996ArticlePubMedPMC
- 9. Burke JR, Downey C, Almoudaris AM. Failure to rescue deteriorating patients: a systematic review of root causes and improvement strategies. J Patient Saf. 2022;18(1):e140-e155. https://doi.org/10.1097/PTS.0000000000000720ArticlePubMed
- 10. Prineas S, Mosier K, Mirko C, Guicciardi S. Non-technical skills in healthcare. In: Donaldson L, Ricciardi W, Sheridan S, Tartaglia R, editors. Textbook of patient safety and clinical risk management. Springer; 2021. p. 413-434. https://doi.org/10.1007/978-3-030-59403-9_30
- 11. Stubbings L, Chaboyer W, McMurray A. Nurses’ use of situation awareness in decision-making: an integrative review. J Adv Nurs. 2012;68(7):1443-1453. https://doi.org/10.1111/j.1365-2648.2012.05989.xArticlePubMed
- 12. Petersen JA, Rasmussen LS, Rydahl-Hansen S. Barriers and facilitating factors related to use of early warning score among acute care nurses: a qualitative study. BMC Emerg Med. 2017;17(1):36. https://doi.org/10.1186/s12873-017-0147-0ArticlePubMedPMC
- 13. Cho KJ, Kwon O, Kwon JM, Lee Y, Park H, Jeon KH, et al. Detecting patient deterioration using artificial intelligence in a rapid response system. Crit Care Med. 2020;48(4):e285-e289. https://doi.org/10.1097/CCM.0000000000004236ArticlePubMed
- 14. Donnelly N, Fry M, Elliott R, Merrick E. The role of the ward nurse in recognition and response to clinical deterioration: a scoping review. Contemp Nurse. 2024;60(6):584-613. https://doi.org/10.1080/10376178.2024.2413125ArticlePMC
- 15. Chung J, Jung H. Indicators of clinical deterioration in adult general ward patients from nurses’ perspectives: a mixed-methods systematic review. BMC Nurs. 2024;23(1):861. https://doi.org/10.1186/s12912-024-02531-6ArticlePubMedPMC
- 16. Orique SB, Despins L. Evaluating situation awareness: an integrative review. West J Nurs Res. 2018;40(3):388-424. https://doi.org/10.1177/0193945917697230ArticlePubMed
- 17. Moens LL, Lydon S, Cucurachi S, O'Connor P, Sauter TC, Töndury GA, et al. Measuring situation awareness: a meta-review across domains. Hum Factors. 2026;68(5):632-672. https://doi.org/10.1177/00187208251412110ArticlePubMedPMC
- 18. Fletcher G, Flin R, McGeorge P, Glavin R, Maran N, Patey R. Anaesthetists’ non-technical skills (ANTS): evaluation of a behavioural marker system. Br J Anaesth. 2003;90(5):580-588. https://doi.org/10.1093/bja/aeg112ArticlePubMed
- 19. Flin R, Patey R. Non-technical skills for anaesthetists: developing and applying ANTS. Best Pract Res Clin Anaesthesiol. 2011;25(2):215-227. https://doi.org/10.1016/j.bpa.2011.02.005ArticlePubMed
- 20. Mishra A, Catchpole K, McCulloch P. The Oxford NOTECHS System: reliability and validity of a tool for measuring teamwork behaviour in the operating theatre. Qual Saf Health Care. 2009;18(2):104-108. https://doi.org/10.1136/qshc.2007.024760ArticlePubMed
- 21. Endsley MR. Measurement of situation awareness in dynamic systems. Hum Factors. 1995;37(1):65-84. https://doi.org/10.1518/001872095779049499Article
- 22. Walshe N, Drennan J, Hegarty J, O'brien S, Crowley C, Ryng S, et al. A cognitive task analysis of final year nursing students’ situation awareness in simulated deteriorating patient events: a mixed methods study. Nurs Open. 2024;11(4):e2154. https://doi.org/10.1002/nop2.2154ArticlePubMedPMC
- 23. Ghaderi C, Esmaeili R, Ebadi A, Amiri MR. Measuring situation awareness in health care providers: a systematic review of measurement properties using COSMIN methodology. Syst Rev. 2023;12(1):60. https://doi.org/10.1186/s13643-023-02220-6ArticlePubMedPMC
- 24. Orique SB, Despins L, Wakefield BJ, Erdelez S, Vogelsmeier A. Perception of clinical deterioration cues among medical-surgical nurses. J Adv Nurs. 2019;75(11):2627-2637. https://doi.org/10.1111/jan.14038ArticlePubMed
- 25. Lavoie P, Cossette S, Pepin J. Testing nursing students’ clinical judgment in a patient deterioration simulation scenario: development of a situation awareness instrument. Nurse Educ Today. 2016;38:61-67. https://doi.org/10.1016/j.nedt.2015.12.015ArticlePubMed
- 26. Churruca K, Ellis LA, Pomare C, Hogden A, Bierbaum M, Long JC, et al. Dimensions of safety culture: a systematic review of quantitative, qualitative and mixed methods for assessing safety culture in hospitals. BMJ Open. 2021;11(7):e043982. https://doi.org/10.1136/bmjopen-2020-043982ArticlePubMedPMC
- 27. DeVellis RF, Thorpe CT. Scale development: theory and applications. 5th ed. SAGE Publications; 2024. p. 1-279.
- 28. Schwartz-Barcott D, Kim HS. An expansion and elaboration of the hybrid model of concept development. In: Rodgers BL, Knafl KA, editors. Concept development in nursing. 2nd ed. Saunders; 2000. p. 129-160.
- 29. Kang HJ, Ha YK. Concept analysis of nurses’ situation awareness in clinical deterioration. J Muscle Joint Health. 2024;31(3):197-207. https://doi.org/10.5953/JMJH.2024.31.3.197Article
- 30. Peltola M, Isotalus P, Åstedt-Kurki P. The Critical Incident Technique (CIT) in studying health care professional-patient communication. Qual Rep. 2022;27(9):1868-1889. https://doi.org/10.46743/2160-3715/2022.5580Article
- 31. Elo S, Kyngäs H. The qualitative content analysis process. J Adv Nurs. 2008;62(1):107-115. https://doi.org/10.1111/j.1365-2648.2007.04569.xArticlePubMedPMC
- 32. Kusmaryono I, Wijayanti D, Maharani HR. Number of response options, reliability, validity, and potential bias in the use of the Likert scale education and social science research: a literature review. Int J Educ Methodol. 2022;8(4):625-637. https://doi.org/10.12973/ijem.8.4.625Article
- 33. Polit DF, Beck CT. The content validity index: are you sure you know what’s being reported?: critique and recommendations. Res Nurs Health. 2006;29(5):489-497. https://doi.org/10.1002/nur.20147ArticlePubMed
- 34. Lee EH. Psychometric properties of an instrument 2: structural validity, internal consistency, and cross-cultural validity/measurement invariance. Korean J Women Health Nurs. 2021;27(2):69-74. https://doi.org/10.4069/kjwhn.2021.05.18ArticlePubMedPMC
- 35. Carpenter S. Ten steps in scale development and reporting: a guide for researchers. Commun Methods Meas. 2018;12(1):25-44. https://doi.org/10.1080/19312458.2017.1396583Article
- 36. Hair JF, Black WC, Babin BJ, Anderson RE. Multivariate data analysis. 8th ed. Cengage Learning; 2019. p. 1-832.
- 37. Curran PJ, West SG, Finch JF. The robustness of test statistics to nonnormality and specification error in confirmatory factor analysis. Psychol Methods. 1996;1(1):16-29. https://doi.org/10.1037/1082-989X.1.1.16Article
- 38. Nunnally JC, Bernstein IH. Psychometric theory. 3rd ed. McGraw-Hill; 1994. p. 1-752.
- 39. Fabrigar LR, Wegener DT, MacCallum RC, Strahan EJ. Evaluating the use of exploratory factor analysis in psychological research. Psychol Methods. 1999;4(3):272-299. https://doi.org/10.1037/1082-989X.4.3.272Article
- 40. Kline RB. Structural regression models. In: Kline RB, editor. Principles and practice of structural equation modeling. 4th ed. Guilford Press; 2016. p. 269-272.
- 41. Newsom JT. Longitudinal measurement invariance. In: Newsom JT, editor. Longitudinal structural equation modeling: a comprehensive introduction. Routledge; 2015. p. 41-44.
- 42. Anderson JC, Gerbing DW. Structural equation modeling in practice: a review and recommended two-step approach. Psychol Bull. 1988;103(3):411-423. https://doi.org/10.1037/0033-2909.103.3.411Article
- 43. Fornell C, Larcker DF. Evaluating structural equation models with unobservable variables and measurement error. J Mark Res. 1981;18(1):39-50. https://doi.org/10.2307/3151312Article
- 44. McNeish D. Thanks coefficient alpha, we'll take it from here. Psychol Methods. 2018;23(3):412-433. https://doi.org/10.1037/met0000144ArticlePubMedPMC
- 45. Gerry S, Bonnici T, Birks J, Kirtley S, Virdee PS, Watkinson PJ, et al. Early warning scores for detecting deterioration in adult hospital patients: systematic review and critical appraisal of methodology. BMJ. 2020;369:m1501. https://doi.org/10.1136/bmj.m1501ArticlePubMedPMC
- 46. Tanii R, Hayashi K, Naito T, Shui-Yee Wong Z, Yoshida T, Hayashi K, et al. Impact of dynamic parameter of trends in vital signs on the prediction of serious events in hospitalized patients: a retrospective observational study. Resusc Plus. 2024;18:100628. https://doi.org/10.1016/j.resplu.2024.100628ArticlePubMedPMC
- 47. Evans JC, Evans MB, Lingard L. Team cognition in healthcare simulation: a framework for deliberate measurement. Adv Simul (Lond). 2025;10(1):12. https://doi.org/10.1186/s41077-025-00333-7ArticlePubMedPMC
- 48. Weller JM, Mahajan R, Fahey-Williams K, Webster CS. Teamwork matters: team situation awareness to build high-performing healthcare teams, a narrative review. Br J Anaesth. 2024;132(4):771-778. https://doi.org/10.1016/j.bja.2023.12.035ArticlePubMed
- 49. Hayes AF, Coutts JJ. Use omega rather than Cronbach’s alpha for estimating reliability: but…. Commun Methods Meas. 2020;14(1):1-24. https://doi.org/10.1080/19312458.2020.1718629Article
References
Figure & Data
REFERENCES
Citations
Citations to this article as recorded by 
 ePub Link
 Cite
Cite XML Download
- Figure
-
- We recommend
- Related articles
-
- Development of emergency nursing educational materials in Lao People's Democratic Republic: a methodological study
- Development and psychometric testing of the Perceived Postoperative Care Competency Scale for Nursing Students: a methodological study
- Development of a machine learning-based prediction model for early hospital readmission after kidney transplantation: a retrospective study
- Development of a communication self-efficacy scale for nurses: a psychometric validation study
- Development of a well-dying awareness scale for middle-aged adults in Korea: a mixed-methods study
Development of a nurses’ situation awareness scale for clinical deterioration: a methodological study
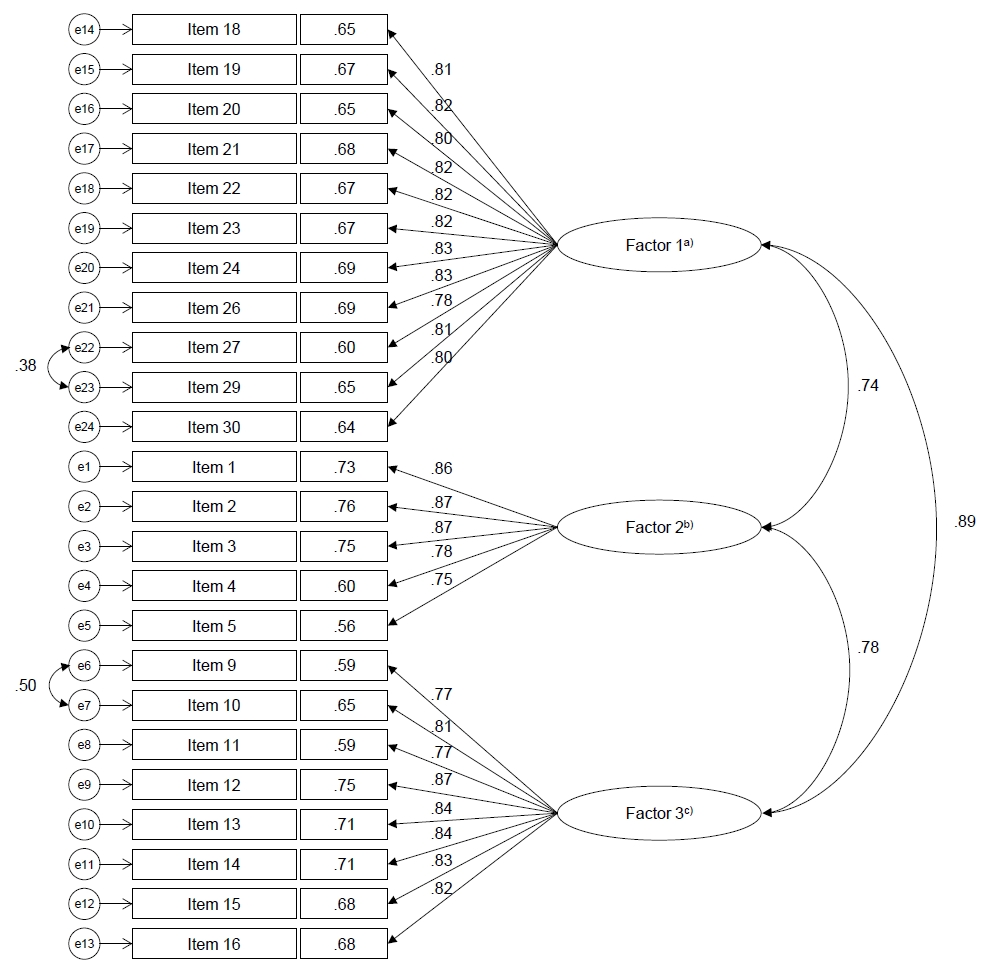
Fig. 1. Results of the confirmatory factor analysis. All estimates are standardized. Standardized factor loadings are shown on the single-headed arrows, and correlations between latent variables are shown on the curved double-headed arrows. e1–e24 denote measurement errors associated with the observed variables included in the final confirmatory factor analysis (items 1–5, 9–16, 18–24, 26–27, and 29–30). a)Factor 1: prediction and preparedness. b)Factor 2: cue capture. c)Factor 3: situation appraisal.
Fig. 1.
Development of a nurses’ situation awareness scale for clinical deterioration: a methodological study
| Characteristic | Total (N=440) | EFA (n=220) | CFA (n=220) | t or χ² | p |
|---|---|---|---|---|---|
| Gender | 2.66 | .103 | |||
| Men | 14 (3.2) | 4 (1.8) | 10 (4.5) | ||
| Women | 426 (96.8) | 216 (98.2) | 210 (95.5) | ||
| Age (yr) | 32.3±7.5 | 33.0±7.8 | 31.6±7.2 | –1.94 | .053 |
| Marital status | 3.16 | .206 | |||
| Married | 158 (35.9) | 86 (39.1) | 72 (32.7) | ||
| Single | 278 (63.2) | 131 (59.5) | 147 (66.8) | ||
| Others | 4 (0.9) | 3 (1.4) | 1 (0.5) | ||
| Education level | 3.69 | .297 | |||
| Diploma | 29 (6.6) | 11 (5.0) | 18 (8.2) | ||
| Bachelor’s | 341 (77.5) | 169 (76.8) | 172 (78.2) | ||
| Graduate program | 70 (15.9) | 40 (18.2) | 30 (13.6) | ||
| Type of hospital | 0.94 | .331 | |||
| Tertiary general hospital | 262 (59.5) | 136 (61.8) | 126 (57.3) | ||
| General hospital | 178 (40.5) | 84 (38.2) | 94 (42.7) | ||
| Type of ward | 2.15 | .542 | |||
| General ward | 238 (54.1) | 117 (53.2) | 121 (55.0) | ||
| Integrated nursing care ward | 200 (45.5) | 102 (46.3) | 98 (44.5) | ||
| Hospice care ward | 1 (0.2) | 0 (0.0) | 1 (0.5) | ||
| Others | 1 (0.2) | 1 (0.5) | 0 (0.0) | ||
| Clinical department | 7.81 | .099 | |||
| Internal medicine | 199 (45.2) | 92 (41.8) | 107 (48.6) | ||
| Neurology | 83 (18.9) | 39 (17.7) | 44 (20.0) | ||
| Surgery | 136 (30.9) | 73 (33.2) | 63 (28.6) | ||
| Rehabilitation | 8 (1.8) | 7 (3.2) | 1 (0.5) | ||
| Others | 14 (3.2) | 9 (4.1) | 5 (2.3) | ||
| Position | 0.48 | .787 | |||
| Staff nurse | 333 (75.7) | 166 (75.4) | 167 (75.9) | ||
| Charge nurse | 86 (19.5) | 42 (19.1) | 44 (20.0) | ||
| Unit manager | 21 (4.8) | 12 (5.5) | 9 (4.1) | ||
| Current work schedule | 1.40 | .496 | |||
| Shift schedule | 397 (90.3) | 197 (89.5) | 200 (90.9) | ||
| Daytime schedule | 42 (9.5) | 23 (10.5) | 19 (8.6) | ||
| Others | 1 (0.2) | 0 (0.0) | 1 (0.5) | ||
| Experience with clinical deterioration training | 0.00 | >.999 | |||
| Yes | 122 (27.7) | 61 (27.7) | 61 (27.7) | ||
| No | 318 (72.3) | 159 (72.3) | 159 (72.3) | ||
| Experience with clinical deterioration events (within the past year) | 0.17 | .679 | |||
| Yes | 379 (86.1) | 191 (86.8) | 188 (85.5) | ||
| No | 61 (13.9) | 29 (13.2) | 32 (14.5) |
| Items | Communality | Factor loading | ||
|---|---|---|---|---|
| 1a) | 2b) | 3c) | ||
| 27 | .73 | .95 | –.03 | .11 |
| 21 | .75 | .91 | –.05 | .02 |
| 29 | .80 | .82 | .16 | .05 |
| 19 | .72 | .78 | .10 | .01 |
| 30 | .76 | .77 | .21 | .07 |
| 24 | .77 | .75 | –.07 | –.20 |
| 22 | .76 | .75 | .01 | –.14 |
| 18 | .71 | .70 | .15 | –.04 |
| 20 | .68 | .69 | .01 | –.15 |
| 23 | .75 | .68 | .04 | –.19 |
| 26 | .70 | .65 | –.03 | –.25 |
| 3 | .80 | .02 | .86 | –.03 |
| 1 | .77 | .19 | .80 | .08 |
| 4 | .73 | .01 | .79 | –.08 |
| 2 | .81 | .04 | .77 | –.15 |
| 5 | .72 | .08 | .61 | –.24 |
| 10 | .79 | –.03 | .01 | –.90 |
| 11 | .71 | .01 | .07 | –.79 |
| 16 | .77 | .22 | –.13 | –.77 |
| 9 | .78 | –.03 | .22 | –.76 |
| 13 | .74 | –.02 | .19 | –.74 |
| 15 | .77 | .20 | .01 | –.70 |
| 12 | .74 | .06 | .23 | –.65 |
| 14 | .74 | .32 | –.03 | –.61 |
| Eigen value | 15.70 | 1.27 | 1.02 | |
| Explained variance (%) | 65.43 | 5.27 | 4.23 | |
| Cumulative (%) | 65.43 | 70.70 | 74.93 | |
| Kaiser-Meyer-Olkin value | .96 | |||
| Bartlett’s test of sphericity | χ2=5,448.47, df=276, p<.001 | |||
| Factor | Items | Standardized estimates | Unstandardized estimates | SE | C.R. | AVE | CR |
|---|---|---|---|---|---|---|---|
| 1a) | 18 | 0.81 | 1 | - | - | 0.66 | 0.96 |
| 29 | 0.81 | 1.02 | 0.07 | 13.96 | |||
| 21 | 0.82 | 1.00 | 0.07 | 14.33 | |||
| 27 | 0.78 | 1.00 | 0.08 | 13.20 | |||
| 26 | 0.83 | 0.97 | 0.07 | 14.52 | |||
| 24 | 0.83 | 0.96 | 0.07 | 14.56 | |||
| 19 | 0.82 | 0.93 | 0.07 | 14.28 | |||
| 30 | 0.80 | 0.93 | 0.07 | 13.71 | |||
| 22 | 0.82 | 0.89 | 0.06 | 14.14 | |||
| 23 | 0.82 | 0.88 | 0.06 | 14.18 | |||
| 20 | 0.80 | 0.86 | 0.06 | 13.87 | |||
| 2b) | 1 | 0.86 | 1 | - | - | 0.68 | 0.91 |
| 2 | 0.87 | 0.99 | 0.06 | 16.80 | |||
| 3 | 0.87 | 0.97 | 0.06 | 16.61 | |||
| 5 | 0.75 | 0.90 | 0.07 | 13.17 | |||
| 4 | 0.78 | 0.84 | 0.06 | 13.90 | |||
| 3c) | 9 | 0.77 | 1 | - | - | 0.67 | 0.94 |
| 12 | 0.87 | 1.18 | 0.08 | 14.14 | |||
| 13 | 0.84 | 1.12 | 0.08 | 13.61 | |||
| 16 | 0.82 | 1.11 | 0.08 | 13.29 | |||
| 10 | 0.81 | 1.08 | 0.06 | 18.24 | |||
| 14 | 0.84 | 1.07 | 0.08 | 13.60 | |||
| 11 | 0.77 | 1.04 | 0.09 | 12.13 | |||
| 15 | 0.83 | 1.03 | 0.08 | 13.32 |
| Factors | SMC (φ2) | AVE | ||
|---|---|---|---|---|
| 1a) | 2b) | 3c) | ||
| 1a) | 1 | .66 | ||
| 2b) | .55 (<.001) | 1 | .68 | |
| 3c) | .79 (<.001) | .61 (<.001) | 1 | .67 |
| Factor | Correlation (φ) | SE | φ–2SE | φ+2SE |
|---|---|---|---|---|
| 1a) ↔ 2b) | .74 (<.001) | 0.03 | 0.68 | 0.80 |
| 1a) ↔ 3c) | .89 (<.001) | 0.02 | 0.85 | 0.93 |
| 2b) ↔ 3c) | .78 (<.001) | 0.03 | 0.72 | 0.84 |
Table 1. General characteristics of participants (N=440)
Values are presented as number (%) or mean±standard deviation. CFA, confirmatory factor analysis; EFA, exploratory factor analysis.
Table 2. Factor loadings, item communalities, and eigenvalues from exploratory factor analysis (24 items) (N=220)
df, degrees of freedom. a)Factor 1: prediction and preparedness. b)Factor 2: cue capture. c)Factor 3: situation appraisal.
Table 3. Convergent validity based on confirmatory factor analysis (N=220)
AVE, average variance extracted; C.R., critical ratio; CR, composite reliability; SE, standard error. a)Factor 1: prediction and preparedness. b)Factor 2: cue capture. c)Factor 3: situation appraisal.
Table 4. Discriminant validity based on the Fornell-Larcker criterion (N=220)
AVE, average variance extracted; SMC, squared multiple correlations. a)Factor 1: prediction and preparedness. b)Factor 2: cue capture. c)Factor 3: situation appraisal.
Table 5. Discriminant validity based on confidence intervals of inter-factor correlations (φ±2SE) (N=220)
SE, standard error. a)Factor 1: prediction and preparedness. b)Factor 2: cue capture. c)Factor 3: situation appraisal.


