 Submit an article
Articles
- Page Path
- HOME > J Korean Acad Nurs > Volume 55(4); 2025 > Article
-
Research Paper
- Development of a machine learning-based prediction model for early hospital readmission after kidney transplantation: a retrospective study
-
Hye Jin Chong1
 , Ji-hyun Yeom2
 -
Journal of Korean Academy of Nursing 2025;55(4):528-542.
DOI: https://doi.org/10.4040/jkan.25030
Published online: November 21, 2025
1Department of Nursing, Sunchon National University, Suncheon, Korea
2Division of Nephrology, Jeonbuk National University Hospital, Jeonju, Korea
- Corresponding author: Hye Jin Chong Department of Nursing, Sunchon National University, 255 Jungang-ro, Suncheon 57922, Korea E-mail: hyejin@scnu.ac.kr
• Received: March 11, 2025 • Revised: September 28, 2025 • Accepted: September 28, 2025
© 2025 Korean Society of Nursing Science
This is an Open Access article distributed under the terms of the Creative Commons Attribution NoDerivs License (http://creativecommons.org/licenses/by-nd/4.0) If the original work is properly cited and retained without any modification or reproduction, it can be used and re-distributed in any format and medium.
- 1,806 Views
- 203 Download
Abstract
-
Purpose
- This study aimed to develop and validate a machine learning-based prediction model for early hospital readmission (EHR) post-kidney transplantation.
-
Methods
- The study was conducted at the organ transplantation center of a university hospital, utilizing data from 470 kidney transplant recipients. We built and trained four machine learning models and tested them to identify the strongest EHR predictors. Predictive performance was evaluated using confusion matrices and the area under the receiver operating characteristic curve (ROC AUC).
-
Results
- Among the 470 kidney transplant recipients with a mean age of 46.1±15.30 years, 322 (68.5%) were males, and 74 (15.7%) were readmitted within 30 days after kidney transplantation. In total, 241 (51.2%) recipients were found to have experienced EHR after applying the random over-sampling examples method. The random forest model achieved the best performance, with an ROC AUC of .87 (validation set) and .82 (test set). The 15 most important features were steroid pulse therapy (recipient), cerebrovascular accident (recipient), heart failure (recipient), male sex (donor), cardiovascular disease (recipient), weekend discharge (recipient), peritoneal dialysis (recipient) cerebrovascular accident as the cause of brain death (donor), current smoker (recipient), cardiac arrest (donor), previous kidney transplantation (recipient), age (donor), hypertension (donor), male sex (recipient), and dialysis duration (recipient).
-
Conclusion
- Our framework demonstrated strong predictive interpretability. It can support appropriate and effective clinical decision-making by assisting transplant professionals in stratifying recipients based on their risk of EHR. prioritizing post-discharge care and follow-up for high-risk individuals, and allocating targeted interventions such as closer monitoring or education.
Introduction
Methods
1) Handling missing data
2) Data encoding and scaling
3) Class balance
Results
Discussion
Conclusion
-
Conflicts of Interest
No potential conflict of interest relevant to this article was reported.
-
Acknowledgements
The authors thank Professor Sik Lee (Nephrology, MD, PhD) at the Jeonbuk National University.
-
Funding
This work was supported by the National Research Foundation of Korea (NRF) grant funded by the Korea government (Ministry of Science and ICT) (No. RS-2023-00241842). The sponsor had no involvement in study design; in the collection, analysis, and interpretation of data; in the writing of the report; or in the decision to submit the article for publication.
-
Data Sharing Statement
The data that support the findings of this study are available on reasonable request from the corresponding author. The data are not publicly available due to privacy or ethical restrictions.
-
Supplementary Data
Supplementary data to this article can be found online at https://doi.org/10.4040/jkan.25030.
Supplementary Table 1. Cross-validation results for each model
jkan-25030-Supplementary-Table-1.pdf
Supplementary Figure 1. Cross-validation results for XGBoost hyperparameter tuning. The figure displays the cross-validated receiver operating characteristic (ROC) scores under various combinations of hyperparameters, including the number of boosting iterations, subsample ratios (0.50, 0.75, 1.00), learning rates (eta: 0.3, 0.4), and max tree depths (1, 2, 3). The x-axis represents the number of boosting iterations and the y-axis indicates the ROC score, which measures the ability of the model to distinguish between classes. Each panel corresponds to a specific combination of subsample and eta values, with lines representing different tree depths.
-
Author Contributions
Conceptualization or/and Methodology: HJC. Data curation or/and Analysis: HJC. Funding acquisition: HJC. Investigation: HJC, JHY. Project administration or/and Supervision: HJC. Resources or/and Software: HJC, JHY. Validation: HJC. Visualization: HJC. Writing original draft or/and Review & Editing: HJC. Final approval of the manuscript: HJC.
Article Information
Fig. 1.Decision tree for predicting early hospital readmission (EHR) after kidney transplantation. A value of “yes” indicates patients who were readmitted within 30 days (EHR=1, blue nodes), while “no” indicates non-readmitted cases (EHR=0, red nodes). CVA, cerebrovascular accident; PD, peritoneal dialysis.

Fig. 2.Comparison of feature importance between random forest and XGBoost models. Feature importance for early hospital readmission prediction using random forest (A) and extreme gradient boosting (XGBoost) (B). Steroid pulse therapy was the strongest predictor in both models, followed by cerebrovascular accident (CVA), comorbid conditions, and dialysis duration. Comorbid condition; the number of any other comorbid disease. CIT, cold ischemic time; CVA, cerebrovascular accident; BMI, body mass index; CVD, cardiovascular disease; d/t, due to; HLA, human leukocyte antigen; HTN, hypertension; ICU, intensive care unit; KT, kidney transplantation; PD, peritoneal dialysis; Tx, therapy.
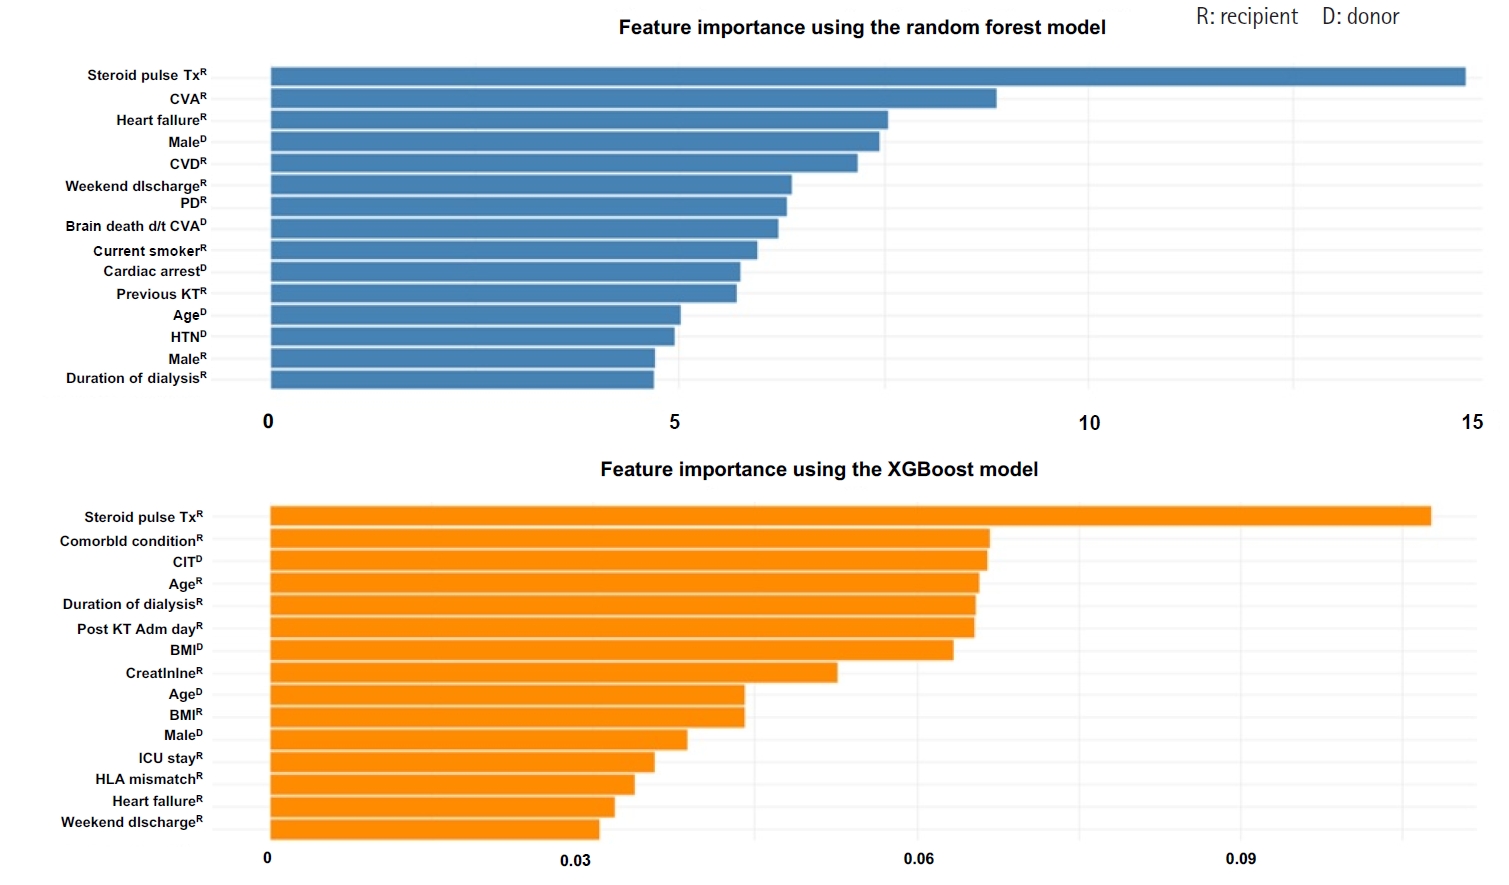
Table 1.Comparison of baseline characteristics between KT recipients with and without early hospital readmission (N=470)
| Characteristic | Total (N=470) | Readmission within 30 days (n=74) | No readmission within 30 days (n=396) | p |
|---|---|---|---|---|
| Donor‑related characteristics | ||||
| Body mass index (kg/m2) | 24.23±3.14 | 23.76±2.95 | 24.31±3.17 | .144 |
| Age (yr) | 46.1±15.30 | 48.5±15.80 | 45.7±15.20 | .170 |
| Sex | .482 | |||
| Male | 246 (52.3) | 42 (56.8) | 204 (51.5) | |
| Female | 224 (47.7) | 32 (43.2) | 192 (48.5) | |
| Cardiac arrest | .343 | |||
| No | 142 (30.2) | 28 (37.8) | 114 (28.8) | |
| Yes | 72 (15.3) | 11 (14.9) | 61 (15.4) | |
| Unknown | 256 (54.5) | 35 (47.3) | 221 (55.8) | |
| Cause of brain death | .061 | |||
| Accident | 121 (25.7) | 18 (24.3) | 103 (26.0) | |
| Cerebrovascular accident | 104 (22.1) | 25 (33.8) | 79 (19.9) | |
| Others | 245 (52.1) | 31 (41.9) | 214 (53.0) | |
| Diabetes mellitus | .103 | |||
| No | 422 (89.8) | 66 (89.1) | 356 (89.9) | |
| Yes | 22 (14.7) | 1 (1.4) | 21 (5.3) | |
| Unknown | 26 (5.5) | 7 (9.5) | 19 (4.8) | |
| Hypertension | .232 | |||
| No | 375 (79.8) | 55 (74.3) | 320 (80.8) | |
| Yes | 69 (14.7) | 12 (16.2) | 57 (14.4) | |
| Unknown | 26 (5.5) | 7 (9.5) | 19 (4.8) | |
| Creatinine (mg/dL) | 1.07±0.70 | 1.13±0.70 | 1.06±0.70 | .453 |
| Recipient‑related characteristics | ||||
| Duration of dialysis (yr) | 3.60±4.30 | 3.85±3.90 | 3.56±4.40 | .562 |
| Human leukocyte antigen mismatch | 3.56±1.40 | 3.63±1.40 | 3.55±1.40 | .639 |
| Body mass index (kg/m2) | 22.55±4.40 | 22.84±3.60 | 22.50±4.60 | .471 |
| Post-KT admission day | 19.00±7.80 | 19.35±10.60 | 18.93±7.20 | .747 |
| Discharge | .005 | |||
| Weekday | 434 (92.3) | 62 (83.8) | 372 (93.9) | |
| Weekend | 36 (7.7) | 12 (16.2) | 24 (6.1) | |
| Age (yr) | 47.1±12.00 | 49.5±12.70 | 46.6±11.80 | .074 |
| Sex | .549 | |||
| Male | 322 (68.5) | 48 (64.9) | 274 (69.2) | |
| Female | 148 (31.5) | 26 (35.1) | 122 (30.8) | |
| KT type | .867 | |||
| Deceased donor KT | 312 (66.4) | 48 (64.9) | 264 (66.7) | |
| Living donor KT | 158 (33.6) | 26 (35.1) | 132 (3.3) | |
| ABO-incompatible transplantation | .291 | |||
| No | 426 (90.6) | 70 (94.6) | 356 (89.9) | |
| Yes | 44 (9.4) | 4 (5.4) | 40 (10.1) | |
| Heart failure | .194 | |||
| No | 412 (87.7) | 61 (82.4) | 351 (88.6) | |
| Yes | 58 (12.3) | 13 (17.6) | 45 (11.4) | |
| Lung disease | .805 | |||
| No | 445 (94.7) | 71 (95.9) | 374 (94.4) | |
| Yes | 25 (5.3) | 3 (4.1) | 22 (5.6) | |
| Cardiovascular disease | .052a) | |||
| No | 445 (94.7) | 74 (100) | 371 (93.7) | |
| Yes | 25 (5.3) | 0 (0) | 25 (6.3) | |
| Cerebrovascular accident | .260a) | |||
| No | 421 (89.6) | 69 (93.2) | 352 (88.9) | |
| Yes | 49 (10.4) | 5 (6.8) | 44 (11.1) | |
| Peripheral vascular disease | .682a) | |||
| No | 443 (94.3) | 71 (95.9) | 372 (93.9) | |
| Yes | 27 (5.7) | 3 (4.1) | 24 (6.1) | |
| History of orthopedic surgery | >.999a) | |||
| No | 450 (95.7) | 71 (95.9) | 379 (95.7) | |
| Yes | 20 (4.3) | 3 (4.1) | 17 (4.3) | |
| No. of any other comorbid condition | .661 | |||
| 0 | 340 (72.4) | 49 (66.2) | 291 (73.5) | |
| 1 | 120 (25.5) | 23 (31.1) | 97 (24.4) | |
| 2 | 8 (1.7) | 2 (2.7) | 6 (1.5) | |
| 3 | 1 (0.2) | 0 (0) | 1 (0.3) | |
| >4 | 1 (0.2) | 0 (0) | 1 (0.3) | |
| Hypertension | .117 | |||
| No | 65 (13.8) | 15 (20.3) | 50 (12.6) | |
| Yes | 405 (86.2) | 59 (79.7) | 346 (87.4) | |
| Smoking habit | .629 | |||
| Nonsmoker | 343 (73.0) | 51 (68.9) | 292 (73.7) | |
| Ex-smoker | 78 (16.6) | 15 (20.3) | 63 (15.9) | |
| Current smoker | 49 (10.4) | 8 (10.8) | 41 (10.4) | |
| Drinking habit | .902 | |||
| Does not drink alcohol | 371 (78.9) | 57 (77.0) | 314 (79.3) | |
| History of drinking | 71 (15.1) | 12 (16.2) | 59 (14.9) | |
| Current drinking | 28 (6.0) | 5 (6.8) | 23 (5.8) | |
| Diabetes mellitus | .350 | |||
| No | 305 (64.9) | 44 (59.5) | 261 (65.9) | |
| Yes | 165 (35.1) | 30 (40.5) | 135 (34.1) | |
| Hepatitis B | .652 | |||
| No | 437 (93.0) | 70 (94.6) | 367 (92.7) | |
| Yes | 29 (6.1) | 4 (5.4) | 25 (6.3) | |
| Unknown | 4 (0.9) | 0 (0) | 4 (1.0) | |
| Cancer | .972 | |||
| No | 441 (93.8) | 70 (94.6) | 371 (93.7) | |
| Yes | 29 (6.2) | 4 (5.4) | 25 (6.3) | |
| Dialysis type | .358 | |||
| Hemodialysis | 429 (91.3) | 65 (87.8) | 364 (91.9) | |
| Peritoneal dialysis | 41 (8.7) | 9 (12.2) | 32 (8.1) | |
| Panel reactive antibody ≥50% | .173 | |||
| No | 311 (66.2) | 42 (56.8) | 269 (67.9) | |
| Yes | 53 (11.3) | 11 (14.8) | 42 (10.6) | |
| Unknown | 106 (22.5) | 21 (28.4) | 85 (21.5) | |
| Previous KT | .748 | |||
| No | 427 (90.9) | 66 (89.2) | 361 (91.2) | |
| Yes | 43 (9.1) | 8 (10.8) | 35 (8.8) | |
| Transplant process factors | ||||
| Cold ischemic time (min) | 113.73±111.70 | 122.39±122.20 | 112.12±111.70 | |
| Delayed graft function | ||||
| No | 438 (93.2) | 65 (87.8) | 373 (94.2) | |
| Yes | 32 (6.8) | 9 (12.2) | 23 (5.8) | |
| Induction immunosuppression | >.999a) | |||
| Bacilimab | 411 (87.4) | 65 (87.8) | 346 (87.4) | |
| Anti-thyroglobulin | 59 (12.6) | 9 (12.2) | 50 (12.6) | |
| Intensive care unit stay (day) | 4.65±2.30 | 4.06±2.40 | 4.76±2.20 | .021 |
| Creatinine at discharge | 1.51±1.30 | 1.54±1.10 | 1.51±1.30 | .808 |
| Steroid pulse therapy | .001 | |||
| No | 436 (92.8) | 57 (77.0) | 379 (95.7) | |
| Yes | 34 (7.2) | 17 (23.0) | 17 (4.3) |
Table 2.Model evaluation via cross-validation (N=470)
| Accuracy (95% CI) | F1-score | Sensitivity | Specificity | ROC AUC | PRC AUC (95% CI)a) | |
|---|---|---|---|---|---|---|
| Decision tree | 0.74 (0.53–0.90) | |||||
| Validation set | 0.72 (0.57–0.84) | 0.51 | 0.63 | 0.83 | 0.73 | |
| Test set | 0.60 (0.45–0.74) | 0.51 | 0.40 | 0.83 | 0.61 | |
| Random forest | 0.90 (0.78–0.97) | |||||
| Validation set | 0.79 (0.63–0.89) | 0.79 | 0.83 | 0.74 | 0.87 | |
| Test set | 0.79 (0.65–0.90) | 0.79 | 0.76 | 0.83 | 0.82 | |
| XGBoost | 0.82 (0.66–0.92) | |||||
| Validation set | 0.70 (0.55–0.83) | 0.79 | 0.79 | 0.61 | 0.79 | |
| Test set | 0.79 (0.65–0.90) | 0.79 | 0.76 | 0.83 | 0.81 | |
| Support vector machine | 0.76 (0.56–0.90) | |||||
| Validation set | 0.66 (0.51–0.79) | 0.68 | 0.71 | 0.61 | 0.74 | |
| Test set | 0.67 (0.52–0.80) | 0.68 | 0.68 | 0.65 | 0.72 |
- 1. Lemoine M, Titeca Beauport D, Lobbedez T, Choukroun G, Hurault de Ligny B, Hazzan M, et al. Risk factors for early graft failure and death after kidney transplantation in recipients older than 70 years. Kidney Int Rep. 2019;4(5):656-666. https://doi.org/10.1016/j.ekir.2019.01.014ArticlePubMedPMC
- 2. Molina M, Sorolla C, Samsó E, Carcaña M, Martín ML, Jatem E, et al. Quality of life in long-term renal transplant patients: a controversial subject. Transplant Proc. 2022;54(1):91-93. https://doi.org/10.1016/j.transproceed.2021.11.025ArticlePubMed
- 3. Tavares MG, Tedesco-Silva Junior H, Pestana JO. Early hospital readmission (EHR) in kidney transplantation: a review article. J Bras Nefrol. 2020;42(2):231-237. https://doi.org/10.1590/2175-8239-JBN-2019-0089ArticlePubMedPMC
- 4. Schinstock CA, Askar M, Bagnasco SM, Batal I, Bow L, Budde K, et al. A 2020 Banff Antibody-mediatedInjury Working Group examination of international practices for diagnosing antibody-mediated rejection in kidney transplantation: a cohort study. Transpl Int. 2021;34(3):488-498. https://doi.org/10.1111/tri.13813ArticlePubMed
- 5. Daugirdas JT, Depner TA. Creatinine generation from kinetic modeling with or without postdialysis serum creatinine measurement: results from the HEMO study. Nephrol Dial Transplant. 2017;32(11):1926-1933. https://doi.org/10.1093/ndt/gfx038ArticlePubMedPMC
- 6. Hogan J, Arenson MD, Adhikary SM, Li K, Zhang X, Zhang R, et al. Assessing predictors of early and late hospital readmission after kidney transplantation. Transplant Direct. 2019;5(8):e479. https://doi.org/10.1097/TXD.0000000000000918ArticlePubMedPMC
- 7. Luan FL, Barrantes F, Roth RS, Samaniego M. Early hospital readmissions post-kidney transplantation are associated with inferior clinical outcomes. Clin Transplant. 2014;28(4):487-493. https://doi.org/10.1111/ctr.12347ArticlePubMed
- 8. Merkow RP, Ju MH, Chung JW, Hall BL, Cohen ME, Williams MV, et al. Underlying reasons associated with hospital readmission following surgery in the United States. JAMA. 2015;313(5):483-495. https://doi.org/10.1001/jama.2014.18614ArticlePubMed
- 9. Lynch RJ, Zhang R, Patzer RE, Larsen CP, Adams AB. First-year waitlist hospitalization and subsequent waitlist and transplant outcome. Am J Transplant. 2017;17(4):1031-1041. https://doi.org/10.1111/ajt.14061ArticlePubMed
- 10. Lynch RJ, Zhang R, Patzer RE, Larsen CP, Adams AB. Waitlist hospital admissions predict resource utilization and survival after renal transplantation. Ann Surg. 2016;264(6):1168-1173. https://doi.org/10.1097/SLA.0000000000001574ArticlePubMed
- 11. Jones CE, Hollis RH, Wahl TS, Oriel BS, Itani KM, Morris MS, et al. Transitional care interventions and hospital readmissions in surgical populations: a systematic review. Am J Surg. 2016;212(2):327-335. https://doi.org/10.1016/j.amjsurg.2016.04.004ArticlePubMed
- 12. Harhay MN, Hill AS, Wang W, Even-Shoshan O, Mussell AS, Bloom RD, et al. Measures of global health status on dialysis signal early rehospitalization risk after kidney transplantation. PLoS One. 2016;11(6):e0156532. https://doi.org/10.1371/journal.pone.0156532ArticlePubMedPMC
- 13. Weinhandl ED, Snyder JJ, Israni AK, Kasiske BL. Effect of comorbidity adjustment on CMS criteria for kidney transplant center performance. Am J Transplant. 2009;9(3):506-516. https://doi.org/10.1111/j.1600-6143.2008.02527.xArticlePubMedPMC
- 14. Kripalani S, Theobald CN, Anctil B, Vasilevskis EE. Reducing hospital readmission rates: current strategies and future directions. Annu Rev Med. 2014;65:471-485. https://doi.org/10.1146/annurev-med-022613-090415ArticlePubMedPMC
- 15. Lubetzky M, Yaffe H, Chen C, Ali H, Kayler LK. Early readmission after kidney transplantation: examination of discharge-level factors. Transplantation. 2016;100(5):1079-1085. https://doi.org/10.1097/TP.0000000000001089ArticlePubMed
- 16. Erickson KF, Winkelmayer WC, Chertow GM, Bhattacharya J. Physician visits and 30-day hospital readmissions in patients receiving hemodialysis. J Am Soc Nephrol. 2014;25(9):2079-2087. https://doi.org/10.1681/ASN.2013080879ArticlePubMedPMC
- 17. Naylor KL, Knoll GA, Slater J, McArthur E, Garg AX, Lam NN, et al. Risk factors and outcomes of early hospital readmission in canadian kidney transplant recipients: a population-based multi-center cohort study. Can J Kidney Health Dis. 2021;8:20543581211060926. https://doi.org/10.1177/20543581211060926ArticlePubMedPMC
- 18. Arenson M, Hogan J, Xu L, Lynch R, Lee YH, Choi JD, et al. Predicting kidney transplant recipient cohorts’ 30-day rehospitalization using clinical notes and electronic health care record data. Kidney Int Rep. 2023;8(3):489-498. https://doi.org/10.1016/j.ekir.2022.12.006ArticlePubMedPMC
- 19. Damen JA, Hooft L, Schuit E, Debray TP, Collins GS, Tzoulaki I, et al. Prediction models for cardiovascular disease risk in the general population: systematic review. BMJ. 2016;353:i2416. https://doi.org/10.1136/bmj.i2416ArticlePubMedPMC
- 20. Taslimitehrani V, Dong G, Pereira NL, Panahiazar M, Pathak J. Developing EHR-driven heart failure risk prediction models using CPXR(Log) with the probabilistic loss function. J Biomed Inform. 2016;60:260-269. https://doi.org/10.1016/j.jbi.2016.01.009ArticlePubMedPMC
- 21. Iniesta R, Stahl D, McGuffin P. Machine learning, statistical learning and the future of biological research in psychiatry. Psychol Med. 2016;46(12):2455-2465. https://doi.org/10.1017/S0033291716001367ArticlePubMedPMC
- 22. Kim J, Gwak D, Kim S, Gang M. Identifying the suicidal ideation risk group among older adults in rural areas: developing a predictive model using machine learning methods. J Adv Nurs. 2023;79(2):641-651. https://doi.org/10.1111/jan.15549ArticlePubMed
- 23. Long WJ, Griffith JL, Selker HP, D’Agostino RB. A comparison of logistic regression to decision-tree induction in a medical domain. Comput Biomed Res. 1993;26(1):74-97. https://doi.org/10.1006/cbmr.1993.1005ArticlePubMed
- 24. Famure O, Kim ED, Li Y, Huang JW, Zyla R, Au M, et al. Outcomes of early hospital readmission after kidney transplantation: perspectives from a Canadian transplant centre. World J Transplant. 2023;13(6):357-367. https://doi.org/10.5500/wjt.v13.i6.357ArticlePubMedPMC
- 25. McAdams-Demarco MA, Grams ME, Hall EC, Coresh J, Segev DL. Early hospital readmission after kidney transplantation: patient and center-level associations. Am J Transplant. 2012;12(12):3283-3288. https://doi.org/10.1111/j.1600-6143.2012.04285.xArticlePubMed
- 26. Panzer RJ. Hospital readmissions and quality of care. Am J Med. 1991;90(6):665-666. https://doi.org/10.1016/s0002-9343(05)80052-xArticlePubMed
- 27. Famure O, Kim ED, Au M, Zyla RE, Huang JW, Chen PX, et al. What are the burden, causes, and costs of early hospital readmissions after kidney transplantation? Prog Transplant. 2021;31(2):160-167. https://doi.org/10.1177/15269248211003563ArticlePubMedPMC
- 28. Kim SH, Baird GL, Bayliss G, Merhi B, Osband A, Gohh R, et al. A single-center analysis of early readmission after renal transplantation. Clin Transplant. 2019;33(5):e13520. https://doi.org/10.1111/ctr.13520ArticlePubMed
- 29. Low JK, Crawford K, Lai J, Manias E. Factors associated with readmission in chronic kidney disease: systematic review and meta-analysis. J Ren Care. 2023;49(4):229-242. https://doi.org/10.1111/jorc.12437ArticlePubMed
- 30. Matsuki K, Kuperman V, Van Dyke JA. The random forests statistical technique: an examination of its value for the study of reading. Sci Stud Read. 2016;20(1):20-33. https://doi.org/10.1080/10888438.2015.1107073ArticlePubMedPMC
- 31. Akin P, Terzı Y. Comparison of unbalanced data methods for support vector machines. Turkiye Klinikleri J Biostat. 2021;13(2):138-146. https://doi.org/10.5336/biostatic.2020-80268Article
- 32. Zhang J, Chen L. Clustering-based undersampling with random over sampling examples and support vector machine for imbalanced classification of breast cancer diagnosis. Comput Assist Surg (Abingdon). 2019;24(sup2):62-72. https://doi.org/10.1080/24699322.2019.1649074ArticlePubMed
- 33. Saito T, Rehmsmeier M. The precision-recall plot is more informative than the ROC plot when evaluating binary classifiers on imbalanced datasets. PLoS One. 2015;10(3):e0118432. https://doi.org/10.1371/journal.pone.0118432ArticlePubMedPMC
- 34. Mandrekar JN. Receiver operating characteristic curve in diagnostic test assessment. J Thorac Oncol. 2010;5(9):1315-1316. https://doi.org/10.1097/jto.0b013e3181ec173dArticlePubMed
- 35. Stratta RJ, Taylor RJ, Sindhi R, Sudan D, Jerius JT, Gill IS. Analysis of early readmissions after combined pancreas-kidney transplantation. Am J Kidney Dis. 1996;28(6):867-877. https://doi.org/10.1016/s0272-6386(96)90387-xArticlePubMed
- 36. Kang IC, Kim IK, Son S, Ju MK. Impact of early hospital readmissions after kidney transplantation on graft function. Transplant Proc. 2018;50(8):2359-2362. https://doi.org/10.1016/j.transproceed.2017.12.062ArticlePubMed
- 37. Balian J, Sakowitz S, Verma A, Vadlakonda A, Cruz E, Ali K, et al. Machine learning based predictive modeling of readmissions following extracorporeal membrane oxygenation hospitalizations. Surg Open Sci. 2024;19:125-130. https://doi.org/10.1016/j.sopen.2024.04.003ArticlePubMedPMC
- 38. Rajula HS, Verlato G, Manchia M, Antonucci N, Fanos V. Comparison of conventional statistical methods with machine learning in medicine: diagnosis, drug development, and treatment. Medicina (Kaunas). 2020;56(9):455. https://doi.org/10.3390/medicina56090455ArticlePubMedPMC
- 39. Talwar A, Lopez-Olivo MA, Huang Y, Ying L, Aparasu RR. Performance of advanced machine learning algorithms overlogistic regression in predicting hospital readmissions: a meta-analysis. Explor Res Clin Soc Pharm. 2023;11:100317. https://doi.org/10.1016/j.rcsop.2023.100317ArticlePubMedPMC
- 40. Wang M, Fu W, He X, Hao S, Wu X. A survey on large-scale machine learning. IEEE Trans Knowl Data Engin. 2020;34(6):2574-2594. https://doi.org/10.1109/TKDE.2020.3015777Article
- 41. Orfanoudaki A, Cook CB, Saghafian S, Castro J, Kosiorek HE, Chakkera HA. Diabetes mellitus and blood glucose variability increases the 30-day readmission rate after kidney transplantation. Clin Transplant. 2024;38(1):e15177. https://doi.org/10.1111/ctr.15177ArticlePubMed
- 42. Steyerberg EW, Uno H, Ioannidis JP, van Calster B. Poor performance of clinical prediction models: the harm of commonly applied methods. J Clin Epidemiol. 2018;98:133-143. https://doi.org/10.1016/j.jclinepi.2017.11.013ArticlePubMed
- 43. Yadlowsky S, Hayward RA, Sussman JB, McClelland RL, Min YI, Basu S. Clinical implications of revised pooled cohort equations for estimating atherosclerotic cardiovascular disease risk. Ann Intern Med. 2018;169(1):20-29. https://doi.org/10.7326/M17-3011ArticlePubMed
- 44. Hart A, Singh D, Brown SJ, Wang JH, Kasiske BL. Incidence, risk factors, treatment, and consequences of antibody-mediated kidney transplant rejection: a systematic review. Clin Transplant. 2021;35(7):e14320. https://doi.org/10.1111/ctr.14320ArticlePubMed
- 45. Rekers NV, de Fijter JW, Claas FH, Eikmans M. Mechanisms and risk assessment of steroid resistance in acute kidney transplant rejection. Transpl Immunol. 2016;38:3-14. https://doi.org/10.1016/j.trim.2016.07.005ArticlePubMed
- 46. Boubaker K, Harzallah A, Ounissi M, Becha M, Guergueh T, Hedri H, et al. Rehospitalization after kidney transplantation during the first year: length, causes and relationship with long-term patient and graft survival. Transplant Proc. 2011;43(5):1742-1746. https://doi.org/10.1016/j.transproceed.2011.01.178ArticlePubMed
- 47. Yang J, Koo T. Development of Korean estimated post-transplant survival score and new deceased donor allocation rule based on K-KDPI. Heal Wkly Rep. 2020;13(37):2768-2770.
- 48. Li AH, Lam NN, Naylor KL, Garg AX, Knoll GA, Kim SJ. Early hospital readmissions after transplantation: burden, causes, and consequences. Transplantation. 2016;100(4):713-718. https://doi.org/10.1097/TP.0000000000000917ArticlePubMed
- 49. Taber DJ, Palanisamy AP, Srinivas TR, Gebregziabher M, Odeghe J, Chavin KD, et al. Inclusion of dynamic clinical data improves the predictive performance of a 30-day readmission risk model in kidney transplantation. Transplantation. 2015;99(2):324-330. https://doi.org/10.1097/TP.0000000000000565ArticlePubMedPMC
- 50. Rahman S, Khan MI, Satu MS, Abedin MZ. Risk prediction with machine learning in cesarean section: optimizing healthcare operational decisions. In: Ahad MA, Ahmed MU, editors. Signal processing techniques for computational health informatics. Springer; 2021. p. 192, 293-314.
References
Figure & Data
REFERENCES
Citations
Citations to this article as recorded by 
 ePub Link
 Cite
CiteDevelopment of a machine learning-based prediction model for early hospital readmission after kidney transplantation: a retrospective study
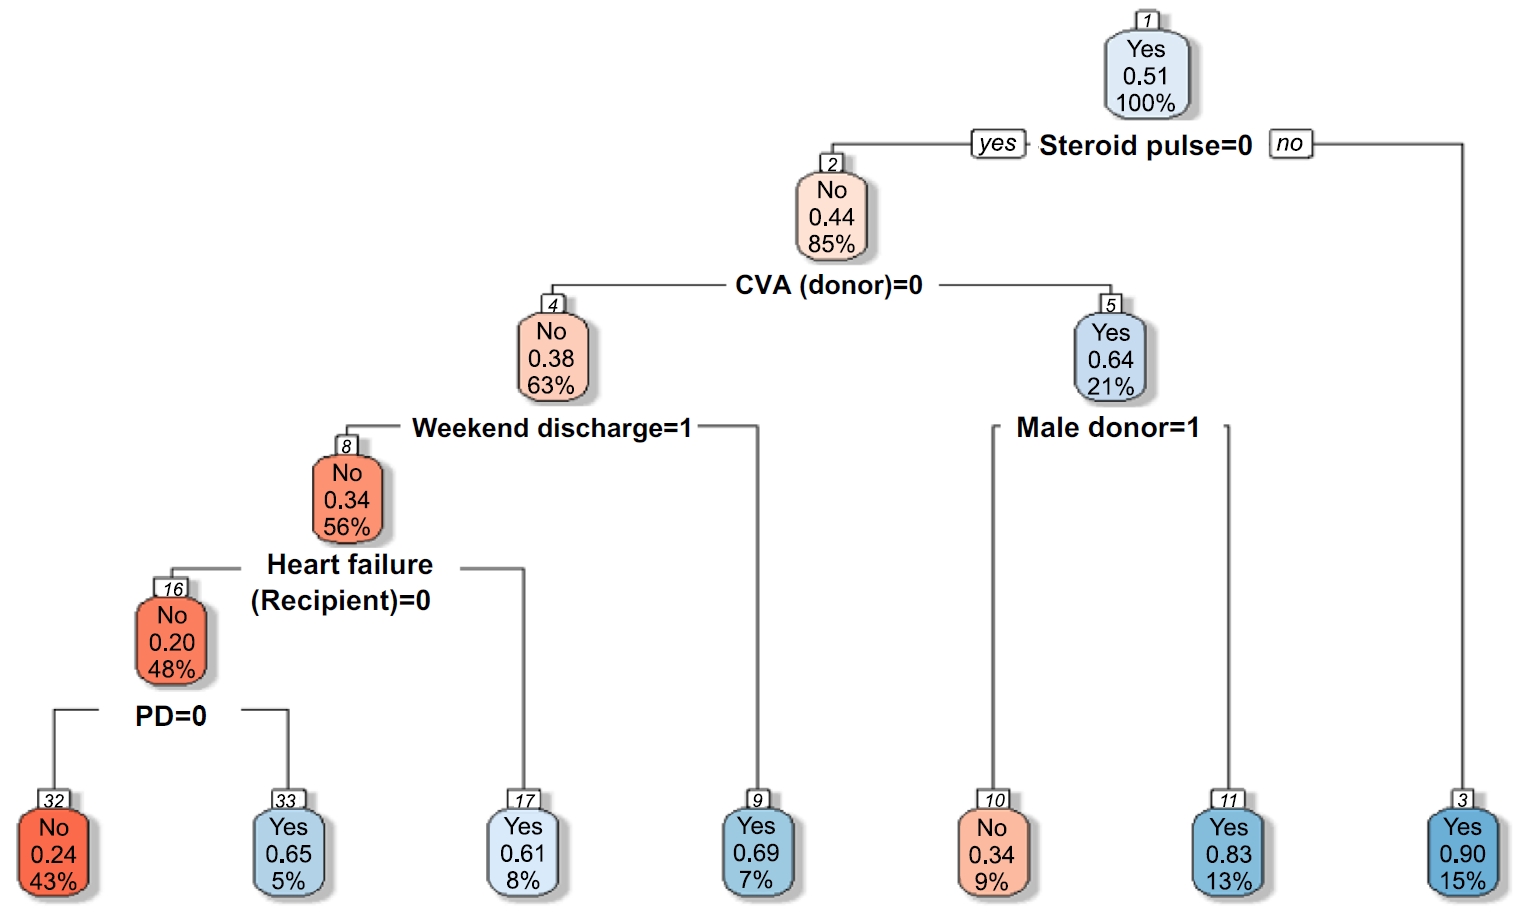

Fig. 1. Decision tree for predicting early hospital readmission (EHR) after kidney transplantation. A value of “yes” indicates patients who were readmitted within 30 days (EHR=1, blue nodes), while “no” indicates non-readmitted cases (EHR=0, red nodes). CVA, cerebrovascular accident; PD, peritoneal dialysis.
Fig. 2. Comparison of feature importance between random forest and XGBoost models. Feature importance for early hospital readmission prediction using random forest (A) and extreme gradient boosting (XGBoost) (B). Steroid pulse therapy was the strongest predictor in both models, followed by cerebrovascular accident (CVA), comorbid conditions, and dialysis duration. Comorbid condition; the number of any other comorbid disease. CIT, cold ischemic time; CVA, cerebrovascular accident; BMI, body mass index; CVD, cardiovascular disease; d/t, due to; HLA, human leukocyte antigen; HTN, hypertension; ICU, intensive care unit; KT, kidney transplantation; PD, peritoneal dialysis; Tx, therapy.
Fig. 1.
Fig. 2.
Development of a machine learning-based prediction model for early hospital readmission after kidney transplantation: a retrospective study
| Characteristic | Total (N=470) | Readmission within 30 days (n=74) | No readmission within 30 days (n=396) | p |
|---|---|---|---|---|
| Donor‑related characteristics | ||||
| Body mass index (kg/m2) | 24.23±3.14 | 23.76±2.95 | 24.31±3.17 | .144 |
| Age (yr) | 46.1±15.30 | 48.5±15.80 | 45.7±15.20 | .170 |
| Sex | .482 | |||
| Male | 246 (52.3) | 42 (56.8) | 204 (51.5) | |
| Female | 224 (47.7) | 32 (43.2) | 192 (48.5) | |
| Cardiac arrest | .343 | |||
| No | 142 (30.2) | 28 (37.8) | 114 (28.8) | |
| Yes | 72 (15.3) | 11 (14.9) | 61 (15.4) | |
| Unknown | 256 (54.5) | 35 (47.3) | 221 (55.8) | |
| Cause of brain death | .061 | |||
| Accident | 121 (25.7) | 18 (24.3) | 103 (26.0) | |
| Cerebrovascular accident | 104 (22.1) | 25 (33.8) | 79 (19.9) | |
| Others | 245 (52.1) | 31 (41.9) | 214 (53.0) | |
| Diabetes mellitus | .103 | |||
| No | 422 (89.8) | 66 (89.1) | 356 (89.9) | |
| Yes | 22 (14.7) | 1 (1.4) | 21 (5.3) | |
| Unknown | 26 (5.5) | 7 (9.5) | 19 (4.8) | |
| Hypertension | .232 | |||
| No | 375 (79.8) | 55 (74.3) | 320 (80.8) | |
| Yes | 69 (14.7) | 12 (16.2) | 57 (14.4) | |
| Unknown | 26 (5.5) | 7 (9.5) | 19 (4.8) | |
| Creatinine (mg/dL) | 1.07±0.70 | 1.13±0.70 | 1.06±0.70 | .453 |
| Recipient‑related characteristics | ||||
| Duration of dialysis (yr) | 3.60±4.30 | 3.85±3.90 | 3.56±4.40 | .562 |
| Human leukocyte antigen mismatch | 3.56±1.40 | 3.63±1.40 | 3.55±1.40 | .639 |
| Body mass index (kg/m2) | 22.55±4.40 | 22.84±3.60 | 22.50±4.60 | .471 |
| Post-KT admission day | 19.00±7.80 | 19.35±10.60 | 18.93±7.20 | .747 |
| Discharge | .005 | |||
| Weekday | 434 (92.3) | 62 (83.8) | 372 (93.9) | |
| Weekend | 36 (7.7) | 12 (16.2) | 24 (6.1) | |
| Age (yr) | 47.1±12.00 | 49.5±12.70 | 46.6±11.80 | .074 |
| Sex | .549 | |||
| Male | 322 (68.5) | 48 (64.9) | 274 (69.2) | |
| Female | 148 (31.5) | 26 (35.1) | 122 (30.8) | |
| KT type | .867 | |||
| Deceased donor KT | 312 (66.4) | 48 (64.9) | 264 (66.7) | |
| Living donor KT | 158 (33.6) | 26 (35.1) | 132 (3.3) | |
| ABO-incompatible transplantation | .291 | |||
| No | 426 (90.6) | 70 (94.6) | 356 (89.9) | |
| Yes | 44 (9.4) | 4 (5.4) | 40 (10.1) | |
| Heart failure | .194 | |||
| No | 412 (87.7) | 61 (82.4) | 351 (88.6) | |
| Yes | 58 (12.3) | 13 (17.6) | 45 (11.4) | |
| Lung disease | .805 | |||
| No | 445 (94.7) | 71 (95.9) | 374 (94.4) | |
| Yes | 25 (5.3) | 3 (4.1) | 22 (5.6) | |
| Cardiovascular disease | .052 |
|||
| No | 445 (94.7) | 74 (100) | 371 (93.7) | |
| Yes | 25 (5.3) | 0 (0) | 25 (6.3) | |
| Cerebrovascular accident | .260 |
|||
| No | 421 (89.6) | 69 (93.2) | 352 (88.9) | |
| Yes | 49 (10.4) | 5 (6.8) | 44 (11.1) | |
| Peripheral vascular disease | .682 |
|||
| No | 443 (94.3) | 71 (95.9) | 372 (93.9) | |
| Yes | 27 (5.7) | 3 (4.1) | 24 (6.1) | |
| History of orthopedic surgery | >.999 |
|||
| No | 450 (95.7) | 71 (95.9) | 379 (95.7) | |
| Yes | 20 (4.3) | 3 (4.1) | 17 (4.3) | |
| No. of any other comorbid condition | .661 | |||
| 0 | 340 (72.4) | 49 (66.2) | 291 (73.5) | |
| 1 | 120 (25.5) | 23 (31.1) | 97 (24.4) | |
| 2 | 8 (1.7) | 2 (2.7) | 6 (1.5) | |
| 3 | 1 (0.2) | 0 (0) | 1 (0.3) | |
| >4 | 1 (0.2) | 0 (0) | 1 (0.3) | |
| Hypertension | .117 | |||
| No | 65 (13.8) | 15 (20.3) | 50 (12.6) | |
| Yes | 405 (86.2) | 59 (79.7) | 346 (87.4) | |
| Smoking habit | .629 | |||
| Nonsmoker | 343 (73.0) | 51 (68.9) | 292 (73.7) | |
| Ex-smoker | 78 (16.6) | 15 (20.3) | 63 (15.9) | |
| Current smoker | 49 (10.4) | 8 (10.8) | 41 (10.4) | |
| Drinking habit | .902 | |||
| Does not drink alcohol | 371 (78.9) | 57 (77.0) | 314 (79.3) | |
| History of drinking | 71 (15.1) | 12 (16.2) | 59 (14.9) | |
| Current drinking | 28 (6.0) | 5 (6.8) | 23 (5.8) | |
| Diabetes mellitus | .350 | |||
| No | 305 (64.9) | 44 (59.5) | 261 (65.9) | |
| Yes | 165 (35.1) | 30 (40.5) | 135 (34.1) | |
| Hepatitis B | .652 | |||
| No | 437 (93.0) | 70 (94.6) | 367 (92.7) | |
| Yes | 29 (6.1) | 4 (5.4) | 25 (6.3) | |
| Unknown | 4 (0.9) | 0 (0) | 4 (1.0) | |
| Cancer | .972 | |||
| No | 441 (93.8) | 70 (94.6) | 371 (93.7) | |
| Yes | 29 (6.2) | 4 (5.4) | 25 (6.3) | |
| Dialysis type | .358 | |||
| Hemodialysis | 429 (91.3) | 65 (87.8) | 364 (91.9) | |
| Peritoneal dialysis | 41 (8.7) | 9 (12.2) | 32 (8.1) | |
| Panel reactive antibody ≥50% | .173 | |||
| No | 311 (66.2) | 42 (56.8) | 269 (67.9) | |
| Yes | 53 (11.3) | 11 (14.8) | 42 (10.6) | |
| Unknown | 106 (22.5) | 21 (28.4) | 85 (21.5) | |
| Previous KT | .748 | |||
| No | 427 (90.9) | 66 (89.2) | 361 (91.2) | |
| Yes | 43 (9.1) | 8 (10.8) | 35 (8.8) | |
| Transplant process factors | ||||
| Cold ischemic time (min) | 113.73±111.70 | 122.39±122.20 | 112.12±111.70 | |
| Delayed graft function | ||||
| No | 438 (93.2) | 65 (87.8) | 373 (94.2) | |
| Yes | 32 (6.8) | 9 (12.2) | 23 (5.8) | |
| Induction immunosuppression | >.999 |
|||
| Bacilimab | 411 (87.4) | 65 (87.8) | 346 (87.4) | |
| Anti-thyroglobulin | 59 (12.6) | 9 (12.2) | 50 (12.6) | |
| Intensive care unit stay (day) | 4.65±2.30 | 4.06±2.40 | 4.76±2.20 | .021 |
| Creatinine at discharge | 1.51±1.30 | 1.54±1.10 | 1.51±1.30 | .808 |
| Steroid pulse therapy | .001 | |||
| No | 436 (92.8) | 57 (77.0) | 379 (95.7) | |
| Yes | 34 (7.2) | 17 (23.0) | 17 (4.3) |
| Accuracy (95% CI) | F1-score | Sensitivity | Specificity | ROC AUC | PRC AUC (95% CI) |
|
|---|---|---|---|---|---|---|
| Decision tree | 0.74 (0.53–0.90) | |||||
| Validation set | 0.72 (0.57–0.84) | 0.51 | 0.63 | 0.83 | 0.73 | |
| Test set | 0.60 (0.45–0.74) | 0.51 | 0.40 | 0.83 | 0.61 | |
| Random forest | 0.90 (0.78–0.97) | |||||
| Validation set | 0.79 (0.63–0.89) | 0.79 | 0.83 | 0.74 | 0.87 | |
| Test set | 0.79 (0.65–0.90) | 0.79 | 0.76 | 0.83 | 0.82 | |
| XGBoost | 0.82 (0.66–0.92) | |||||
| Validation set | 0.70 (0.55–0.83) | 0.79 | 0.79 | 0.61 | 0.79 | |
| Test set | 0.79 (0.65–0.90) | 0.79 | 0.76 | 0.83 | 0.81 | |
| Support vector machine | 0.76 (0.56–0.90) | |||||
| Validation set | 0.66 (0.51–0.79) | 0.68 | 0.71 | 0.61 | 0.74 | |
| Test set | 0.67 (0.52–0.80) | 0.68 | 0.68 | 0.65 | 0.72 |
Table 1. Comparison of baseline characteristics between KT recipients with and without early hospital readmission (N=470)
Values are presented as mean±standard deviation or number (%) unless otherwise stated. KT, kidney transplantation. By Fishier exact test.
Table 2. Model evaluation via cross-validation (N=470)
AUC, area under the curve; CI, confidence interval; PRC, precision-recall curve; ROC, receiver operating characteristic curve; XGBoost, extreme gradient boost. PRC 95% CI results obtained from bootstrapping (1,000 repetitions).

