 Submit an article
Articles
- Page Path
- HOME > J Korean Acad Nurs > Volume 55(3); 2025 > Article
-
Research Paper
치유농업 프로그램이 노인의 우울, 스트레스 및 인지기능에 미치는 효과: 유사실험연구 -
박규연
 , 이광옥
, 이광옥 - Effects of an agro-healing program on depression, stress, and cognitive function in older adults: a quasi-experimental study
-
Gyu Yeon Park, Kwang Ok Lee
-
Journal of Korean Academy of Nursing 2025;55(3):342-352.
DOI: https://doi.org/10.4040/jkan.25058
Published online: August 21, 2025
상명대학교 융합기술대학 간호학과
Department of Nursing, College of Convergence Technology, Sangmyung University, Cheonan, Korea
- Corresponding author: Kwang Ok Lee Department of Nursing, College of Convergence Technology, Sangmyung University, 31 Sangmyeongdae-gil, Dongnam-gu, Cheonan 31066, Korea E-mail: kolee@smu.ac.kr
- †본 원고는 제1저자 박규연의 2025년 석사학위논문(상명대학교)을 축약한 것이다.
• Received: April 18, 2025 • Revised: August 6, 2025 • Accepted: August 7, 2025
© 2025 Korean Society of Nursing Science
This is an Open Access article distributed under the terms of the Creative Commons Attribution NoDerivs License (http://creativecommons.org/licenses/by-nd/4.0) If the original work is properly cited and retained without any modification or reproduction, it can be used and re-distributed in any format and medium.
- 4,016 Views
- 367 Download
- 1 Crossref
Abstract
-
Purpose
- This study aimed to evaluate the effects of an agro-healing program on depression, stress, and cognitive function in older adults.
-
Methods
- A quasi-experimental, nonequivalent control group pretest–posttest design was used. The study was conducted from July 16 to September 6, 2024. Sixty-two individuals aged 65 or older residing in Gimcheon, Gyeongsangbuk-do, were recruited according to the selection criteria (31 in the experimental group and 31 in the control group). The final analysis included 30 participants in each group. The program was delivered by one main instructor (a healing farmer) and three assistants. The pretest assessed general characteristics, the Geriatric Depression Scale Short Form-Korean version, Stress Response Inventory-Modified Form, and Cognitive Impairment Screening Test. The experimental group participated in the agro-healing program once a week for 90 minutes over 8 weeks. The posttest included the same measurements as the pretest. Data were analyzed using IBM SPSS ver. 23.0.
-
Results
- The experimental group, which participated in the healing agriculture program, showed reduced depression (F=7.97, p=.007) and stress (F=282.70, p<.001) and improved cognitive function (F=10.12, p=.002) compared to the control group.
-
Conclusion
- The findings suggest that the agro-healing program is an effective intervention for reducing depression and stress and improving cognitive function in older adults. We propose its use to promote health and prevent dementia in this population.
서론
방법
1) 우울
2) 스트레스
3) 인지기능
4) 치유농업 프로그램
결과
고찰
결론
-
Conflicts of Interest
No potential conflict of interest relevant to this article was reported.
-
Acknowledgements
None.
-
Data Sharing Statement
Please contact the corresponding author for data availability.
-
Author Contributions
Conceptualization or/and Methodology: GYP, KOL. Data curation or/and Analysis: GYP, KOL. Funding acquisition: GYP. Investigation: GYP. Project administration or/and Supervision: KOL. Resources or/and Software: GYP. Validation: GYP. Visualization: GYP. Writing: original draft or/and Review & Editing: GYP, KOL. Final approval of the manuscript: all authors.
Article Information

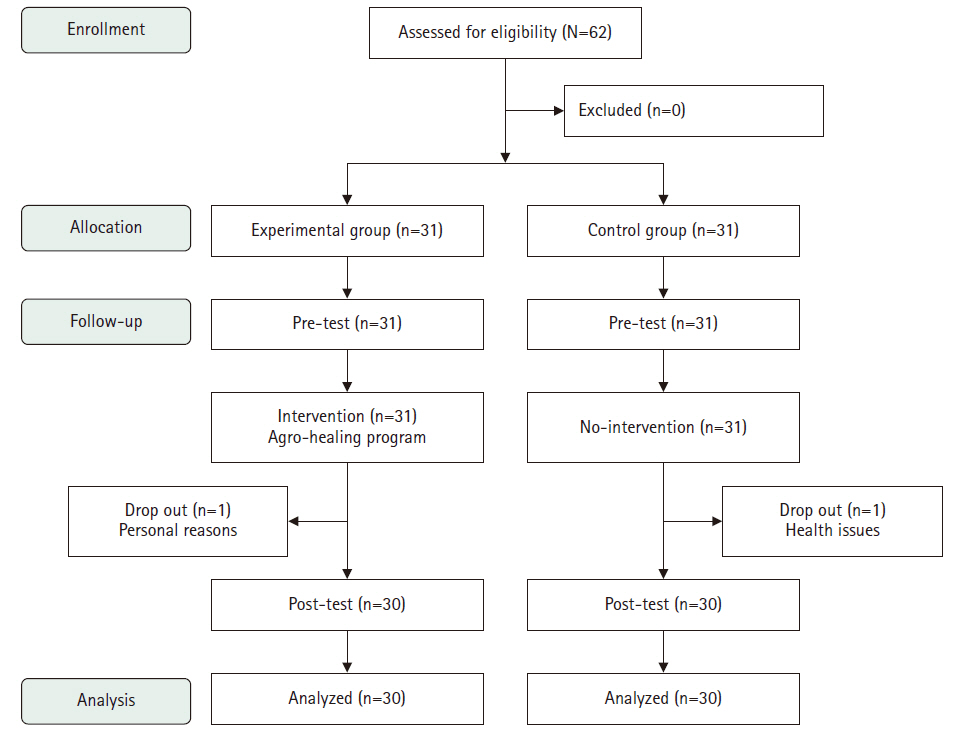
Table 1.Homogeneity of general characteristics between the experimental and control groups (N=60)
| Characteristic | Exp. (n=30) | Cont. (n=30) | χ2/t | p |
|---|---|---|---|---|
| Gender | 0.07 | .795 | ||
| Men | 13 (43.3) | 14 (46.7) | ||
| Women | 17 (56.7) | 16 (53.3) | ||
| Age (yr) | 0.99a) | .855 | ||
| 65–69 | 5 (16.7) | 4 (13.3) | ||
| 70–74 | 9 (30.0) | 8 (26.7) | ||
| 75–79 | 11 (36.6) | 10 (33.3) | ||
| ≥80 | 5 (16.7) | 8 (26.7) | ||
| Body mass index (kg/m2) | 22.30±1.86 | 22.26±1.74 | 0.09 | .926 |
| Obesity | 1.75a) | .686 | ||
| Underweight | 2 (6.7) | 2 (6.7) | ||
| Normal weight | 20 (66.6) | 17 (56.6) | ||
| Overweight | 5 (16.7) | 9 (30.0) | ||
| Obesity | 3 (10.0) | 2 (6.7) | ||
| Body movement | 0.90a) | .894 | ||
| Very good | 3 (10.0) | 2 (6.7) | ||
| Good | 12 (40.0) | 15 (50.0) | ||
| A little difficult | 13 (43.3) | 11 (36.6) | ||
| Very difficult | 2 (6.7) | 2 (6.7) | ||
| Health status | 0.56a) | .976 | ||
| Very good | 6 (20.0) | 6 (20.0) | ||
| Good | 12 (40.0) | 14 (46.6) | ||
| A little bad | 10 (33.3) | 8 (26.7) | ||
| Very bad | 2 (6.7) | 2 (6.7) | ||
| Religion | 0.07 | .791 | ||
| Yes | 12 (40.0) | 11 (36.7) | ||
| No | 18 (60.0) | 19 (63.3) | ||
| Educational level | 0.62a) | .960 | ||
| ≤Elementary school | 13 (43.3) | 14 (46.7) | ||
| middle school | 9 (30.0) | 7 (23.3) | ||
| High school | 6 (20.0) | 6 (20.0) | ||
| ≥Community college | 2 (6.7) | 3 (10.0) | ||
| Living arrangement | 0.61a) | .938 | ||
| Only couples | 20 (66.6) | 18 (60.0) | ||
| Living alone | 6 (20.0) | 7 (23.3) | ||
| With children | 2 (6.7) | 3 (10.0) | ||
| Other | 2 (6.7) | 2 (6.7) | ||
| Economic status | 0.61a) | .786 | ||
| Upper | 2 (6.7) | 3 (10.0) | ||
| Middle | 26 (86.6) | 24 (80.0) | ||
| Lower | 2 (6.7) | 3 (10.0) |
Table 2.Baseline homogeneity of dependent variables between the experimental and control groups (N=60)
| Variable | Exp. (n=30) | Cont. (n=30) | t | p |
|---|---|---|---|---|
| Depression | 7.37±3.07 | 7.27±3.28 | 0.12 | .903 |
| Stress | 27.30±10.92 | 24.83±10.44 | 0.89 | .375 |
| CIST | 20.67±3.60 | 20.50±4.12 | 0.17 | .868 |
Table 3.Effects of the agro-healing program on depression, stress, and cognitive function (N=60)
Values are presented as mean±SD or mean±SE, unless otherwise stated. CIST adjusted pre-value, 20.58; Depression adjusted pre-value, 7.32; Stress adjusted pre-value, 26.07.
CIST, cognitive impairment screening test; Cont., control group; Exe., experimental group; SD, standard deviation; SE, standard error.
- 1. Statistics Korea. 2023 Senior citizen statistics [Internet]. Statistics Korea; 2023 [cited 2024 Sep 30]. Available from: http://kostat.go.kr
- 2. Kim Y, Han MI, Park JI, Chung S. An investigation of factors affecting elderly depression in Korea. J Korean Geriatr Psychiatry. 2021;25(2):120-127. https://doi.org/10.47825/jkgp.2021.25.2.120Article
- 3. Conwell Y, Rotenberg M, Caine ED. Completed suicide at age 50 and over. J Am Geriatr Soc. 1990;38(6):640-644. https://doi.org/10.1111/j.1532-5415.1990.tb01422.xArticlePubMed
- 4. Jeon YJ. The effect of the elderly’s stress on depression: focused on mediating effect of resilience and moderating effect of social activity. Korean J Hum Ecol. 2015;24(2):219-236. https://doi.org/10.5934/kjhe.2015.24.2.219Article
- 5. Ministry of Health and Welfare. 2020 Report on the survey of the elderly [Internet]. Ministry of Health and Welfare; 2021 [cited 2024 Sep 5]. Available from: http://mohw.go.kr
- 6. Lee J, Yang S. On the moderating and mediating effects of ego-integrity and resilience in the relationship between daily stress and depression in the elderly. Korean J Dev Psychol. 2019;32(4):151-169. https://doi.org/10.35574/KJDP.2019.12.32.4.151Article
- 7. Folkman S. Stress: appraisal and coping. In: Gellman MD, Turner JR, editors. Encyclopedia of behavioral medicine. Springer; 2013. p. 1913-1915. https://doi.org/10.1007/978-1-4419-1005-9_215
- 8. Shin KR, Kim JS. A study on the relationship between stress and depression in elderly women. J Korean Gerontol Nurs [Internet]. 2003 [cited 2024 Sep 30];5(1):29-37. Available from: https://www.jkgn.org/upload/pdf/jkgn-5-29.pdf
- 9. Park GA, Oh MH. Relationships between cognitive function and self efficacy, health behavior of the elderly participation to physical activity. J Rehabil Res. 2016;20(1):189-210. https://doi.org/10.16884/JRR.2016.20.1.189Article
- 10. World Health Organization. Decade of healthy ageing: baseline report. World Health Organization; 2021.
- 11. Central Dementia Center. The 4th National Dementia Management Plan (2021-2025). Central Dementia Center; 2020.
- 12. Mohanty M, Kumar P. Multi-component interventions in older adults having subjective cognitive decline (SCD): a review article. Geriatrics (Basel). 2022;8(1):4. https://doi.org/10.3390/geriatrics8010004ArticlePubMedPMC
- 13. Korea Law Information Center. Act on Research, Development, and Promotion of Healing Agriculture, Act No. 17100 (Mar 25, 2021) [Internet]. Ministry of Government Legislation; 2021 [cited 2024 Sep 20]. Available from: https://elaw.klri.re.kr/eng_service/lawView.do?lang=ENG&hseq=55063
- 14. Rural Development Administration; National Institute of Horticultural and Herbal Science. Korean Netherlands agro-healing (care farm). Jinhan M&B; 2021.
- 15. Park YJ. The research on green healing agriculture impact on life satisfaction and the psychological well-being [dissertation]. Yongin: Westminster Graduate School of Theology; 2020.
- 16. Jeong SJ, Kim DY, Yoo EH, Kang YK. The effect of mindfulness-based agro-healing program on mental health: focusing on gardening activities. Ment Health Soc Work. 2023;51(1):145-170. https://doi.org/10.24301/MHSW.2023.03.51.1.145Article
- 17. Kang HS. A qualitative case study of a therapeutic farming program for recovering alcoholics. Health Welf. 2024;26(3):59-91. https://doi.org/10.23948/kshw.2024.09.30.3.59Article
- 18. Yesavage JA, Sheikh JI. 9/Geriatric Depression Scale (GDS): recent evidence and development of a shorter version. Clin Gerontol. 1986;5(1-2):165-173. https://doi.org/10.1300/J018v05n01_09Article
- 19. Kee BS. A preliminary study for the standardization of Geriatric Depression Scale Short Form-Korea version. J Korean Neuropsychiatr Assoc [Internet]. 1996 [cited 2024 Sep 30];35(2):298-307. Available from: http://imgsvr.riss4u.net/contents/kdam/A/1045/9602/1045960206.pdf
- 20. Koh KB, Park JK, Kim CH. Development of the Stress Response Inventory. J Korean Neuropsychiatr Assoc [Internet]. 2000 [cited 2024 Sep 30];39(4):707-719. Available from: https://www.koreamed.org/SearchBasic.php?RID=2340472
- 21. Choi SM, Kang TY, Woo JM. Development and validation of a modified form of the Stress Response Inventory for workers. J Korean Neuropsychiatr Assoc [Internet]. 2006 [cited 2024 Sep 30];45(6):541-553. Available from: https://www.koreamed.org/SearchBasic.php?RID=2341240
- 22. Ministry of Health and Welfare. Cognitive Impairment Screening Test (CIST) manual [Internet]. Ministry of Health and Welfare; 2021 [cited 2024 Jul 1]. Available from: https://www.nid.or.kr/info/dataroom_view.aspx?bid=216
- 23. Jeong SJ, Jang HS, Yoo EH, Kim JS, Lee GW. The effects of the level of plant growing activity on the subjective health, depression, and human relations of the elderly participating in weekend farms. J Korean Soc Rural Plan. 2019;25(4):57-64. https://doi.org/10.7851/ksrp.2019.25.4.057Article
- 24. Chu HY, Chen MF, Tsai CC, Chan HS, Wu TL. Efficacy of a horticultural activity program for reducing depression and loneliness in older residents of nursing homes in Taiwan. Geriatr Nurs. 2019;40(4):386-391. https://doi.org/10.1016/j.gerinurse.2018.12.012ArticlePubMed
- 25. Han K, Lee S, Suh JK. Effect of group horticultural therapy on the change of depression and self-esteem in older adult. J Korean Soc People Plants Environ [Internet]. 2009 [cited 2024 Sep 30];12(4):1-12. Available from: https://www.kci.go.kr/kciportal/ci/sereArticleSearch/ciSereArtiView.kci?sereArticleSearchBean.artiId=ART001370180
- 26. Jang HS, Gim GM, Jeong SJ, Kim JS. Community gardening activities and their effects on mental health of residents. J People Plants Environ. 2019;22(4):333-340. https://doi.org/10.11628/ksppe.2019.22.4.333Article
- 27. Kang MH. Effects of horticultural intervention program on cognition, emotion, communication and problematic behavior in older adults with Alzheimer [dissertation]. Daejeon: Chungnam National University; 2005.
- 28. Choi EY. Effect of healing agriculture program on improvement of mild cognitive impairment [master's thesis]. Daegu: Kyungpook National University; 2022.
References
Figure & Data
REFERENCES
Citations
Citations to this article as recorded by 
- The concept and characteristics of agro-healing foods: results from focus group interviews and a Delphi survey among experts
Dahye Han, Chae-Ryeon Kim, Jaesin Lee, Kyeong-a Jang, Sohyun Park
Journal of Nutrition and Health.2026; 59(3): 303. CrossRef
 ePub Link
 Cite
Cite- Figure
-
- We recommend
- Related articles
-
- Effects of a practitioner-led empowerment program for low-income social service recipients in South Korea: a quasi-experimental study
- Effects of an integrated healthcare program for postpartum women: a quasi-experimental study
- Effects of a nursing leadership program on self-leadership, interpersonal relationships, clinical performance, problem-solving abilities, and nursing professionalism among nursing students in South Korea: a quasi-experimental study
- Development and effects of a media-based reproductive health promotion program for male high school students at male high school: a quasi-experimental study
Effects of an agro-healing program on depression, stress, and cognitive function in older adults: a quasi-experimental study
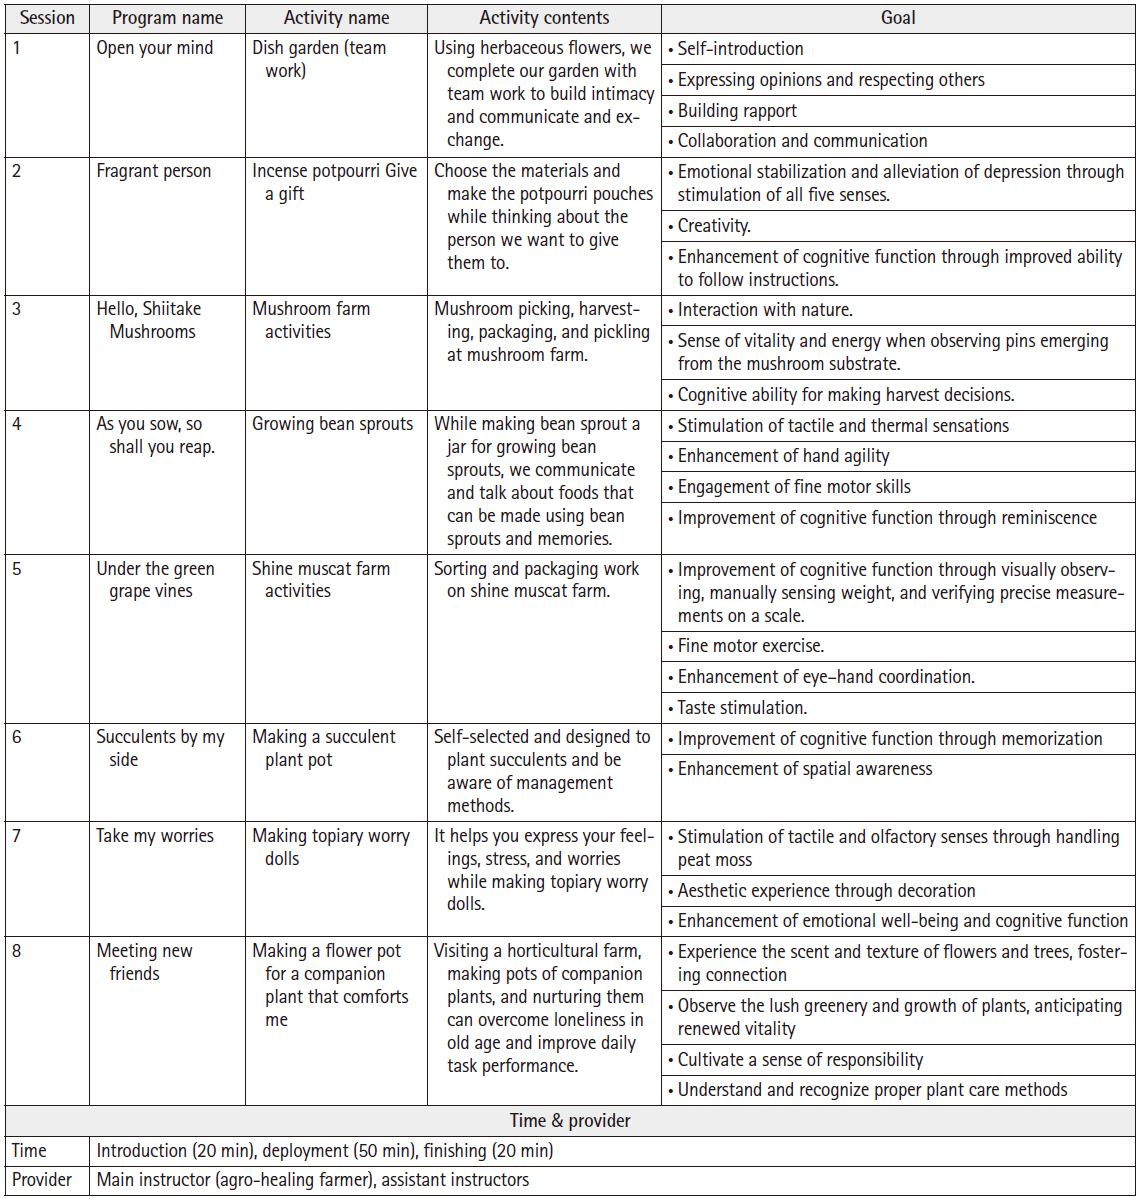

Fig. 1. Agro-healing program.
Fig. 2. Flow diagram of participant allocation, follow-up, and analysis.
Fig. 1.
Fig. 2.
Effects of an agro-healing program on depression, stress, and cognitive function in older adults: a quasi-experimental study
| Characteristic | Exp. (n=30) | Cont. (n=30) | χ2/t | p |
|---|---|---|---|---|
| Gender | 0.07 | .795 | ||
| Men | 13 (43.3) | 14 (46.7) | ||
| Women | 17 (56.7) | 16 (53.3) | ||
| Age (yr) | 0.99 |
.855 | ||
| 65–69 | 5 (16.7) | 4 (13.3) | ||
| 70–74 | 9 (30.0) | 8 (26.7) | ||
| 75–79 | 11 (36.6) | 10 (33.3) | ||
| ≥80 | 5 (16.7) | 8 (26.7) | ||
| Body mass index (kg/m2) | 22.30±1.86 | 22.26±1.74 | 0.09 | .926 |
| Obesity | 1.75 |
.686 | ||
| Underweight | 2 (6.7) | 2 (6.7) | ||
| Normal weight | 20 (66.6) | 17 (56.6) | ||
| Overweight | 5 (16.7) | 9 (30.0) | ||
| Obesity | 3 (10.0) | 2 (6.7) | ||
| Body movement | 0.90 |
.894 | ||
| Very good | 3 (10.0) | 2 (6.7) | ||
| Good | 12 (40.0) | 15 (50.0) | ||
| A little difficult | 13 (43.3) | 11 (36.6) | ||
| Very difficult | 2 (6.7) | 2 (6.7) | ||
| Health status | 0.56 |
.976 | ||
| Very good | 6 (20.0) | 6 (20.0) | ||
| Good | 12 (40.0) | 14 (46.6) | ||
| A little bad | 10 (33.3) | 8 (26.7) | ||
| Very bad | 2 (6.7) | 2 (6.7) | ||
| Religion | 0.07 | .791 | ||
| Yes | 12 (40.0) | 11 (36.7) | ||
| No | 18 (60.0) | 19 (63.3) | ||
| Educational level | 0.62 |
.960 | ||
| ≤Elementary school | 13 (43.3) | 14 (46.7) | ||
| middle school | 9 (30.0) | 7 (23.3) | ||
| High school | 6 (20.0) | 6 (20.0) | ||
| ≥Community college | 2 (6.7) | 3 (10.0) | ||
| Living arrangement | 0.61 |
.938 | ||
| Only couples | 20 (66.6) | 18 (60.0) | ||
| Living alone | 6 (20.0) | 7 (23.3) | ||
| With children | 2 (6.7) | 3 (10.0) | ||
| Other | 2 (6.7) | 2 (6.7) | ||
| Economic status | 0.61 |
.786 | ||
| Upper | 2 (6.7) | 3 (10.0) | ||
| Middle | 26 (86.6) | 24 (80.0) | ||
| Lower | 2 (6.7) | 3 (10.0) |
| Variable | Exp. (n=30) | Cont. (n=30) | t | p |
|---|---|---|---|---|
| Depression | 7.37±3.07 | 7.27±3.28 | 0.12 | .903 |
| Stress | 27.30±10.92 | 24.83±10.44 | 0.89 | .375 |
| CIST | 20.67±3.60 | 20.50±4.12 | 0.17 | .868 |
| Variable | Pre-test |
Post-test |
Adjusted post-value |
F (p) |
|---|---|---|---|---|
| Mean±SD | Mean±SD | Mean±SE | ||
| Depression | 7.97 (.007) | |||
| Exp. (n=30) | 7.37±3.07 | 6.47±2.60 | 6.42±0.23 | |
| Cont. (n=30) | 7.27±3.28 | 7.30±3.38 | 7.34±0.23 | |
| Stress | 282.70 (<.001) | |||
| Exp. (n=30) | 27.30±10.92 | 22.70±10.53 | 21.52±0.34 | |
| Cont. (n=30) | 24.83±10.44 | 28.47±10.30 | 29.65±0.34 | |
| CIST | 10.12 (.002) | |||
| Exp. (n=30) | 20.67±3.60 | 21.53±3.08 | 21.46±0.21 | |
| Cont. (n=30) | 20.50±4.18 | 20.47±3.67 | 20.54±0.21 |
Table 1. Homogeneity of general characteristics between the experimental and control groups (N=60)
Values are presented as number (%), mean±standard deviation. Cont., control group; Exe., experimental group. By Fisher’s exact test.
Table 2. Baseline homogeneity of dependent variables between the experimental and control groups (N=60)
Values are presented as mean±standard deviation. CIST, cognitive impairment screening test; Cont., control group; Exe., experimental group.
Table 3. Effects of the agro-healing program on depression, stress, and cognitive function (N=60)
Values are presented as mean±SD or mean±SE, unless otherwise stated. CIST adjusted pre-value, 20.58; Depression adjusted pre-value, 7.32; Stress adjusted pre-value, 26.07. CIST, cognitive impairment screening test; Cont., control group; Exe., experimental group; SD, standard deviation; SE, standard error.

