 Submit an article
Articles
- Page Path
- HOME > J Korean Acad Nurs > Volume 55(3); 2025 > Article
-
Research Paper
- Impact of an integrated disease-specific nursing care model on parental anxiety and depression in severe hypospadias patients in China: a randomized controlled trial
-
Ruijuan Wu1
 , Lucai Jia1, Biyu Ding1, Ying Li1, Yaqing Cao1, Zhaojun Shi1, Yanfang Yang1
 -
Journal of Korean Academy of Nursing 2025;55(3):327-341.
DOI: https://doi.org/10.4040/jkan.24147
Published online: August 12, 2025
Department of Urology, Children’s Hospital Affiliated to Zhengzhou University, Henan Children’s Hospital, Zhengzhou Children’s Hospital, Zhengzhou, China
- Corresponding author: Ruijuan Wu Department of Urology, Children’s Hospital Affiliated to Zhengzhou University, Henan Children’s Hospital, Zhengzhou Children’s Hospital, 33 Longhu Waihuan East Road, Zhengzhou, Henan 450018, China E-mail: wrj63963705@163.com
• Received: December 19, 2024 • Revised: March 16, 2025 • Accepted: June 21, 2025
© 2025 Korean Society of Nursing Science
This is an Open Access article distributed under the terms of the Creative Commons Attribution NoDerivs License (http://creativecommons.org/licenses/by-nd/4.0) If the original work is properly cited and retained without any modification or reproduction, it can be used and re-distributed in any format and medium.
- 3,409 Views
- 199 Download
Abstract
-
Purpose
- This study aimed to explore the effects of an integrated disease-specific nursing care model on alleviating perioperative and post-surgical anxiety and depression in parents of children with severe hypospadias.
-
Methods
- Parents of children with severe hypospadias were recruited and randomly allocated into a control group (n=93), which received standard nursing care, and an intervention group (n=87), which was given an integrated disease-specific nursing intervention in addition to standard care. Parental anxiety and depression were measured using the Self-Rating Anxiety Scale (SAS) and Self-Rating Depression Scale (SDS) at admission, discharge, and 6-month follow-up post-surgery.
-
Results
- A linear mixed-effects model showed that SAS and SDS scores in the intervention group decreased to a significantly greater extent over time, from admission to follow-up, compared to the control group. Post-hoc analysis showed a trend for increased parental anxiety and depression among patients with complications at discharge and follow-up for the control group. Meanwhile, the intervention group exhibited a trend for decreased parental anxiety and depression among patients with complications at discharge and follow-up.
-
Conclusion
- The integrated disease-specific nursing model significantly alleviated parental anxiety and depression over time compared to standard care, highlighting its effectiveness in supporting families of children with severe hypospadias. Notably, the intervention appeared to mitigate the negative emotional impact of postoperative and follow-up complications, suggesting its potential as a targeted approach to improve both emotional well-being and overall care outcomes.
Introduction
Methods
1) Admission care
(1) Control group
(2) Intervention group
(3) Contribution to outcomes
2) Preoperative care
(1) Control group
(2) Intervention group
(3) Contribution to outcomes
3) Postoperative care
(1) Control group
(2) Intervention group
(3) Contribution to outcomes
4) Post discharge and follow-up
(1) Control group
(2) Intervention group
(3) Contribution to outcomes
(4) Details on the use of the WeChat platform
Results
1) Impact of time point, group, and interaction effects on depression and anxiety scores
2) Post-hoc comparisons of SDS and SAS scores between groups
3) Within-group changes in depression and anxiety over time
4) Regression analysis of predictors for anxiety and depression
Discussion
Conclusion
-
Conflicts of Interest
No potential conflict of interest relevant to this article was reported.
-
Acknowledgements
None.
-
Funding
This research received no external funding.
-
Data Sharing Statement
Please contact the corresponding author for data availability.
-
Supplementary Data
Supplementary data to this article can be found online at https://doi.org/10.4040/jkan.24147.
Supplementary Table 1.
jkan-24147-Supplementary-Table-1.pdf
Supplementary Figure 1.
-
Author Contributions
Conceptualization or/and Methodology: YY, RW. Data curation or/and Analysis: RW, LJ, BD, YL, YY. Funding acquisition: none. Investigation: RW, LJ, BD, YL, YC, ZS. Project administration or/and Supervision: YY, RW. Resources or/and Software: YC, ZS. Validation: RW, LJ, BD. Visualization: LJ, BD. Writing: original draft or/and Review & Editing: RW, LJ, BD. Final approval of the manuscript: all authors.
Article Information
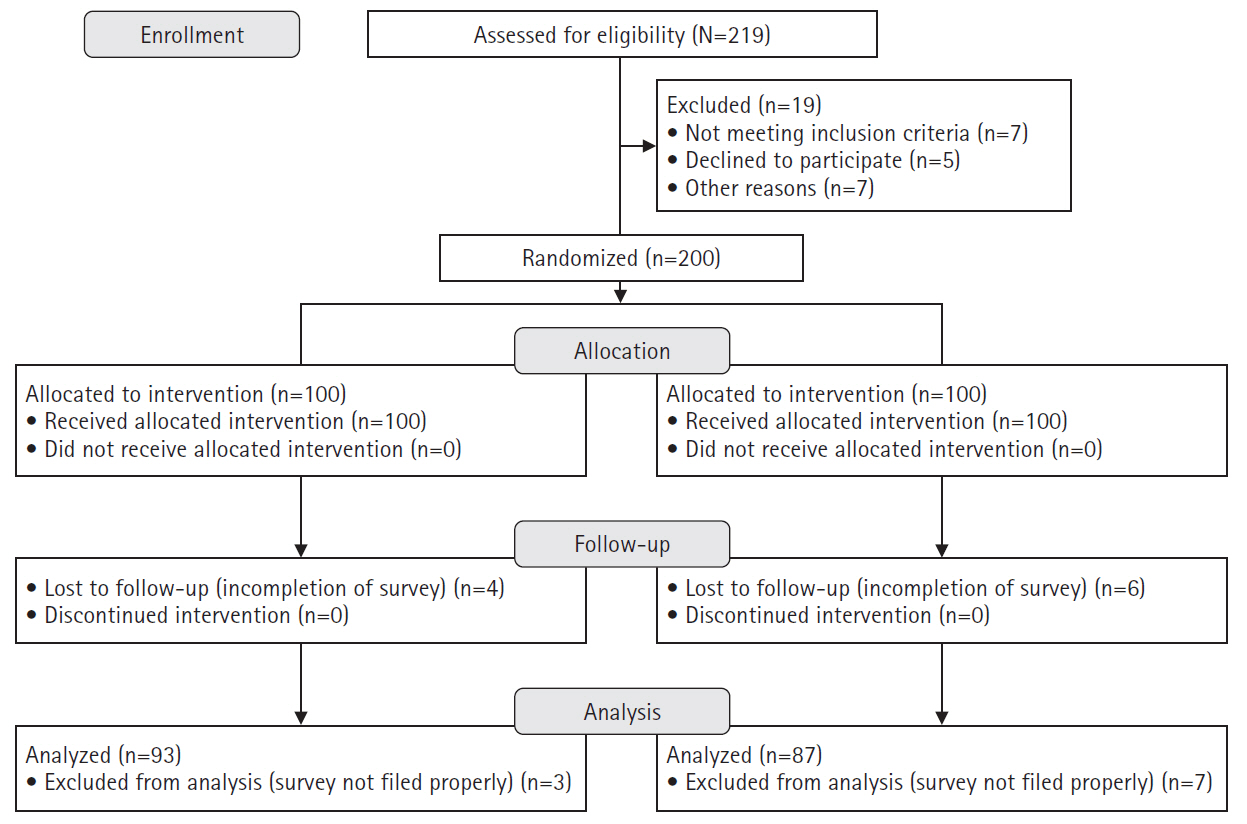
Figure 2.(A–D) Mean differences in depression and anxiety scores between the control and intervention groups at discharge and the 6-month follow-up. SAS, Self-Rating Anxiety Scale; SDS, Self-Rating Depression Scale. **p<.01. ***p<.001.
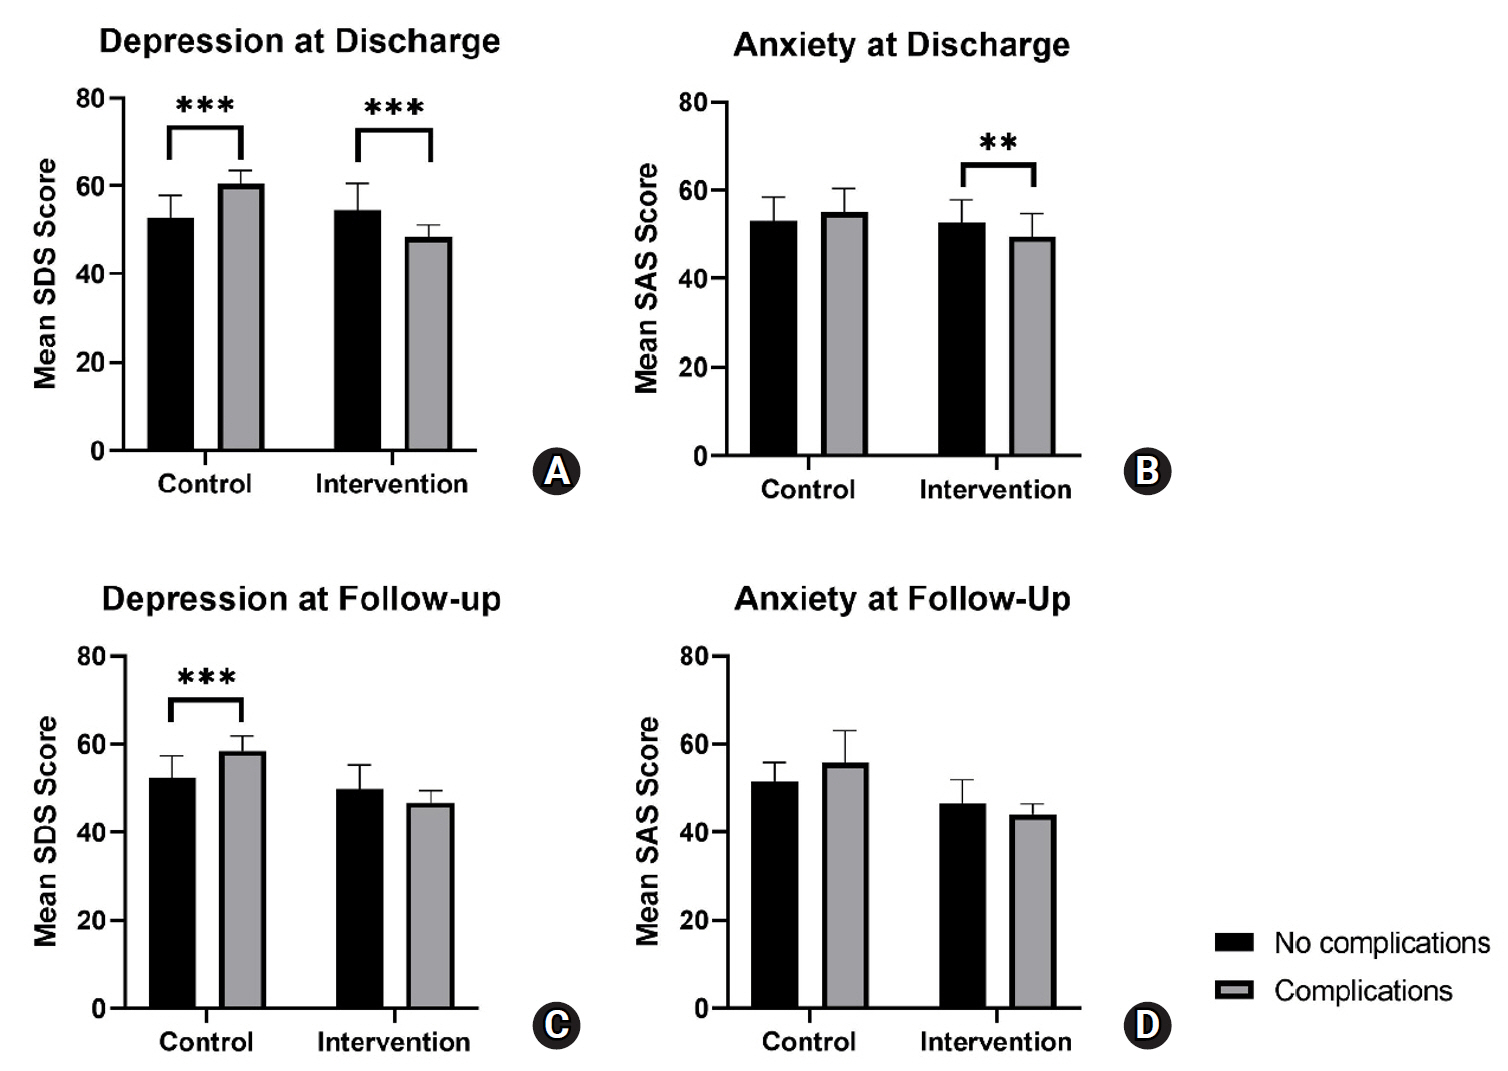
Table 1.Baseline characteristics of children with hypospadias and their parents
Table 2.Treatment outcomes, postoperative complications, and parental SAS/SDS scores
Values are presented as number (%) or mean±standard deviation.
SAS, Self-Rating Anxiety Scale; SDS, Self-Rating Depression Scale.
a)The chi-square test was used to compare categorical variables and the Student t-test was used to compare numerical variables unless otherwise indicated. b)By Mann-Whitney U test.
Table 3.Post-hoc comparison of anxiety and depression scores between intervention and control groups at each time point
Table 4.Post-hoc comparison of within-group changes in anxiety and depression scores over time
- 1. Shan X, Aguilar S, Canon S. Hypospadias prevalence by severity and associated risk factors: a population-based active surveillance analysis. J Pediatr Urol. 2023;19(6):720.e1-720.e9. https://doi.org/10.1016/j.jpurol.2023.08.010ArticlePubMed
- 2. Yu X, Nassar N, Mastroiacovo P, Canfield M, Groisman B, Bermejo-Sánchez E, et al. Hypospadias prevalence and trends in international birth defect surveillance systems, 1980-2010. Eur Urol. 2019;76(4):482-490. https://doi.org/10.1016/j.eururo.2019.06.027ArticlePubMedPMC
- 3. Snodgrass W, Bush N. Surgery for primary proximal hypospadias with ventral curvature >30°. Curr Urol Rep. 2015;16(10):69. https://doi.org/10.1007/s11934-015-0543-5ArticlePubMed
- 4. He Z, Yang B, Tang Y, Mao Y. Analysis of factors associated with postoperative complications after primary hypospadias repair: a retrospective study. Transl Androl Urol. 2022;11(11):1577-1585. https://doi.org/10.21037/tau-22-691ArticlePubMedPMC
- 5. Hu J, Zhao Y, He T, Chen Y, Wang Z, Peng L. Risk factors for postoperative complications following one-stage proximal hypospadias repair involving the disconnection of the urethral plate: a retrospective study. BMC Pediatr. 2023;23(1):504. https://doi.org/10.1186/s12887-023-04339-wArticlePubMedPMC
- 6. Wang CX, Zhang WP, Song HC. Complications of proximal hypospadias repair with transverse preputial island flap urethroplasty: a 15-year experience with long-term follow-up. Asian J Androl. 2019;21(3):300-303. https://doi.org/10.4103/aja.aja_115_18ArticlePubMedPMC
- 7. Geoffrion R, Koenig NA, Zheng M, Sinclair N, Brotto LA, Lee T, et al. Preoperative depression and anxiety impact on inpatient surgery outcomes: a prospective cohort study. Ann Surg Open. 2021;2(1):e049. https://doi.org/10.1097/AS9.0000000000000049ArticlePubMedPMC
- 8. Santapuram P, Stone AL, Walden RL, Alexander L. Interventions for parental anxiety in preparation for pediatric surgery: a narrative review. Children (Basel). 2021;8(11):1069. https://doi.org/10.3390/children8111069ArticlePubMedPMC
- 9. Ndomba AL, Laisser RM, Konje ET, Mwanga JR, Mshana SE. Life with an indwelling urinary catheter: experiences from male patients attending the urology clinic at a tertiary hospital in northwestern Tanzania: a qualitative study. Nurs Rep. 2022;12(4):791-803. https://doi.org/10.3390/nursrep12040077ArticlePubMedPMC
- 10. Mazloum H, Razaghi N, Vashani HB, Pourbadakhshan N. Effect of animation display of urinary catheterization on the anxiety of mothers with hospitalized children: a quasi-experimental study. J Holist Nurs Midwifery. 2024;34(3):262-269. https://doi.org/10.32598/jhnm.34.2.2704Article
- 11. Fukushima T, Shoji K, Tanaka A, Aoyagi Y, Okui S, Sekiguchi M, et al. Indwelling catheters increase altered mental status and urinary tract infection risk: a retrospective cohort study. Ann Med Surg (Lond). 2021;64:102186. https://doi.org/10.1016/j.amsu.2021.102186ArticlePubMedPMC
- 12. Hu L, Hua Y, Wang L, Mao Z, Jia X, Lei Z, et al. Effect of short-term deep breathing exercises on perioperative anxiety and pain in pediatric orthopedic patients: a randomized controlled trial. J Perianesth Nurs. 2025;40(1):69-75. https://doi.org/10.1016/j.jopan.2024.03.009ArticlePubMed
- 13. Colletti CJ, Forehand R, Garai E, Rakow A, McKee L, Fear JM, et al. Parent depression and child anxiety: an overview of the literature with clinical implications. Child Youth Care Forum. 2009;38(3):151-160. https://doi.org/10.1007/s10566-009-9074-xArticlePubMedPMC
- 14. Kain A, Mueller C, Golianu BJ, Jenkins BN, Fortier MA. The impact of parental health mindset on postoperative recovery in children. Paediatr Anaesth. 2021;31(3):298-308. https://doi.org/10.1111/pan.14071ArticlePubMedPMC
- 15. Chow CH, Schmidt LA, Buckley DN. The role of anxiety and related states in pediatric postsurgical pain. Can J Pain. 2020;4(4):26-36. https://doi.org/10.1080/24740527.2020.1847600ArticlePubMedPMC
- 16. Li J, Deng Q, Zhao S, Sun J. Analysis of the nursing effects of integrated medical and nursing care intervention in correction surgery for children with concealed penis. BMC Nurs. 2024;23(1):436. https://doi.org/10.1186/s12912-024-01851-xArticlePubMedPMC
- 17. O’Brien K, Robson K, Bracht M, Cruz M, Lui K, Alvaro R, et al. Effectiveness of Family Integrated Care in neonatal intensive care units on infant and parent outcomes: a multicentre, multinational, cluster-randomised controlled trial. Lancet Child Adolesc Health. 2018;2(4):245-254. https://doi.org/10.1016/S2352-4642(18)30039-7ArticlePubMed
- 18. Mahdizadeh M, Nejat Mohammad A, Behnam Vashani H, Reyhani T. Effects of supportive educational program on anxiety of mothers of children undergoing the lumbar puncture (LP). Evid Based Care. 2016;6(2):29-38. https://doi.org/10.22038/ebcj.2016.7313Article
- 19. Chen H, Lin Z, Chen J, Li X, Zhao L, Chen W, et al. The impact of an interactive, multifaceted education approach for congenital cataract on parental anxiety, knowledge and satisfaction: a randomized, controlled trial. Patient Educ Couns. 2020;103(2):321-327. https://doi.org/10.1016/j.pec.2019.09.002ArticlePubMed
- 20. Ji L, Zhang X, Fan H, Han M, Yang H, Tang L, et al. drawMD APP-aided preoperative anesthesia education reduce parents anxiety and improve satisfaction. Patient Educ Couns. 2016;99(2):265-270. https://doi.org/10.1016/j.pec.2015.08.027ArticlePubMed
- 21. Liu SJ, Yen WJ, Chang YZ, Ku MS. Impact of educational videos on maternal anxiety caused by children’s heart surgery. Nurs Crit Care. 2023;28(6):1106-1114. https://doi.org/10.1111/nicc.12786ArticlePubMed
- 22. Karaburun MC, Akıncı A, Kubilay E, Özkaya MF, Soygür YT, Burgu B. The impact of audiovisual information on parental anxiety levels prior to hypospadias surgery: a prospective single center cohort study. J Pediatr Urol. 2024;20(4):746.e1-746.e7. https://doi.org/10.1016/j.jpurol.2024.06.012ArticlePubMed
- 23. Duan H, Wang L, Li H, Wang Z, Jiao S, Liu Y, et al. The influence of WeChat education and care program on anxiety, depression, insomnia, and general state of health in parents of pediatric acute lymphoblastic leukemia patients. J Cancer Res Clin Oncol. 2024;150(3):138. https://doi.org/10.1007/s00432-024-05646-0ArticlePubMedPMC
- 24. Zhang Y, Liu R, Li G, Mao S, Yuan Y. The reliability and validity of a Chinese-version Short Health Anxiety Inventory: an investigation of university students. Neuropsychiatr Dis Treat. 2015;11:1739-1747. https://doi.org/10.2147/NDT.S83501ArticlePubMedPMC
- 25. Lee HC. Reliability, validity and fakability of the Zung Self-rating Depression Scale. Bull Hong Kong Psychol Soc. 1990;24-25:5-15.
- 26. Gabrys JB, Peters K. Reliability, discriminant and predictive validity of the Zung Self-rating Depression Scale. Psychol Rep. 1985;57(3):1091-1096. https://doi.org/10.2466/pr0.1985.57.3f.1091ArticlePubMed
- 27. Dunstan DA, Scott N. Norms for Zung’s self-rating anxiety scale. BMC Psychiatry. 2020;20(1):90. https://doi.org/10.1186/s12888-019-2427-6ArticlePubMedPMC
- 28. Tanaka-Matsumi J, Kameoka VA. Reliabilities and concurrent validities of popular self-report measures of depression, anxiety, and social desirability. J Consult Clin Psychol. 1986;54(3):328-333. https://doi.org/10.1037//0022-006x.54.3.328ArticlePubMed
- 29. Yue J, Zang X, Le Y, An Y. Anxiety, depression and PTSD among children and their parent during 2019 novel coronavirus disease (COVID-19) outbreak in China. Curr Psychol. 2022;41(8):5723-5730. https://doi.org/10.1007/s12144-020-01191-4ArticlePubMedPMC
- 30. Misra D, Elbourne C, Vareli A, Banerjee D, Joshi A, Friedmacher F, et al. Challenges in managing proximal hypospadias: a 17-year single-center experience. J Pediatr Surg. 2019;54(10):2125-2129. https://doi.org/10.1016/j.jpedsurg.2019.04.019ArticlePubMed
- 31. Chan KH, Panoch J, Carroll A, Wiehe S, Downs S, Cain MP, et al. Parental perspectives on decision-making about hypospadias surgery. J Pediatr Urol. 2019;15(5):449.e1-449.e8. https://doi.org/10.1016/j.jpurol.2019.04.017ArticlePubMedPMC
- 32. Zhao Y, Wang X. Effect of integrated nursing care based on medical alliance mode on the prevention and treatment of complications and self-efficacy of patients with coronary heart disease after PCI. J Healthc Eng. 2022;2022:7727953. https://doi.org/10.1155/2022/7727953ArticlePubMedPMC
- 33. Cheng C, Franck LS, Ye XY, Hutchinson SA, Lee SK, O’Brien K. Evaluating the effect of Family Integrated Care on maternal stress and anxiety in neonatal intensive care units. J Reprod Infant Psychol. 2019;39(2):166-179. https://doi.org/10.1080/02646838.2019.1659940ArticlePubMed
- 34. Tiryaki Ö, Çınar N, Caner İ. The effect of family integrated care on preparing parents with premature infants hospitalized in the neonatal intensive care unit for discharge. J Perinatol. 2024;44(7):1014-1021. https://doi.org/10.1038/s41372-024-01931-5ArticlePubMedPMC
- 35. César-Santos B, Bastos F, Dias A, Campos MJ. Family nursing care during the transition to parenthood: a scoping review. Healthcare (Basel). 2024;12(5):515. https://doi.org/10.3390/healthcare12050515ArticlePubMedPMC
- 36. Shahraki SK, Bazyar M, Nematollahi M, Emadi SF, Tavan A. Impact of family-centered care on parenting role and sense of competence in parents of preterm neonates: a quasi-experimental study. J Neonatal Nurs. 2025;31(1):267-274. https://doi.org/10.1016/j.jnn.2024.08.012Article
- 37. Pinho LG, Correia T, Lopes MJ, Fonseca C, Marques MD, Sampaio F, et al. Patient-centered care for people with depression and anxiety: an integrative review protocol. J Pers Med. 2021;11(5):411. https://doi.org/10.3390/jpm11050411ArticlePubMedPMC
- 38. Khosravi M, Azar G, Izadi R. Principles and elements of patient-centredness in mental health services: a thematic analysis of a systematic review of reviews. BMJ Open Qual. 2024;13(3):e002719. https://doi.org/10.1136/bmjoq-2023-002719ArticlePubMedPMC
- 39. Jlala HA, French JL, Foxall GL, Hardman JG, Bedforth NM. Effect of preoperative multimedia information on perioperative anxiety in patients undergoing procedures under regional anaesthesia. Br J Anaesth. 2010;104(3):369-374. https://doi.org/10.1093/bja/aeq002ArticlePubMed
- 40. Cagiran E, Sergin D, Deniz MN, Tanattı B, Emiroglu N, Alper I. Effects of sociodemographic factors and maternal anxiety on preoperative anxiety in children. J Int Med Res. 2014;42(2):572-580. https://doi.org/10.1177/0300060513503758ArticlePubMed
- 41. Bellew M, Atkinson KR, Dixon G, Yates A. The introduction of a paediatric anaesthesia information leaflet: an audit of its impact on parental anxiety and satisfaction. Paediatr Anaesth. 2002;12(2):124-130. https://doi.org/10.1046/j.1460-9592.2002.00788.xArticlePubMed
- 42. Pidgeon TE, Blore CD, Webb Y, Horton J, Evans M. A patient information leaflet reduces parental anxiety before their child’s first craniofacial multidisciplinary outpatient appointment. J Craniofac Surg. 2017;28(7):1772-1776. https://doi.org/10.1097/SCS.0000000000003955ArticlePubMed
- 43. Landier M, Villemagne T, Le Touze A, Braïk K, Meignan P, Cook AR, et al. The position of a written document in preoperative information for pediatric surgery: a randomized controlled trial on parental anxiety, knowledge, and satisfaction. J Pediatr Surg. 2018;53(3):375-380. https://doi.org/10.1016/j.jpedsurg.2017.04.009ArticlePubMed
- 44. Zhang QL, Liu JF, Xie WP, Cao H, Chen Q. The effect of WeChat on parental care burden, anxiety, and depression in children after CHD surgery during COVID-19 pandemic. Appl Clin Inform. 2021;12(4):768-773. https://doi.org/10.1055/s-0041-1733850ArticlePubMedPMC
- 45. Papasarantopoulou A, Polikandrioti M, Dousis E, Evagelou E, Zartaloudi A, Dafogianni C, et al. Anxiety and depression in parents of children undergoing Hematopoietic Stem Cell Transplant (HSCT). Adv Exp Med Biol. 2023;1425:31-46. https://doi.org/10.1007/978-3-031-31986-0_4ArticlePubMed
- 46. Wang Z, Deng S, Lv H, Fan Y, Zhang L, Wang F. Effect of WeChat-based continuous care intervention on the somatic function, depression, anxiety, social function and cognitive function for cancer patients: meta-analysis of 18 RCTs. Nurs Open. 2023;10(9):6045-6057. https://doi.org/10.1002/nop2.1916ArticlePubMedPMC
- 47. Guo S, Lin WH, Lin SH, Zhang QL, Cao H, Chen Q. Using WeChat to guide preparation before transthoracic echocardiography reduces anxiety and improves satisfaction of parents of infants with congenital heart disease. J Cardiothorac Surg. 2023;18(1):176. https://doi.org/10.1186/s13019-023-02225-1ArticlePubMedPMC
- 48. Boyden JY, Hill DL, Carroll KW, Morrison WE, Miller VA, Feudtner C. The association of perceived social support with anxiety over time in parents of children with serious illnesses. J Palliat Med. 2020;23(4):527-534. https://doi.org/10.1089/jpm.2019.0387ArticlePubMedPMC
- 49. Gariépy G, Honkaniemi H, Quesnel-Vallée A. Social support and protection from depression: systematic review of current findings in Western countries. Br J Psychiatry. 2016;209(4):284-293. https://doi.org/10.1192/bjp.bp.115.169094ArticlePubMed
- 50. Miklósi M, Szabó M, Martos T, Galambosi E, Perczel Forintos D. Cognitive emotion regulation strategies moderate the effect of parenting self-efficacy beliefs on parents’ anxiety following their child’s surgery. J Pediatr Psychol. 2013;38(4):462-471. https://doi.org/10.1093/jpepsy/jss174ArticlePubMed
- 51. Bandura A. Self-efficacy: toward a unifying theory of behavioral change. Psychol Rev. 1977;84(2):191-215. https://doi.org/10.1037//0033-295x.84.2.191ArticlePubMed
- 52. Lazarus RS, Folkman S. Stress, appraisal, and coping. New York: Springer; 1994.
References
References
Figure & Data
REFERENCES
Citations
Citations to this article as recorded by 
 ePub Link
 Cite
CiteImpact of an integrated disease-specific nursing care model on parental anxiety and depression in severe hypospadias patients in China: a randomized controlled trial


Figure 1. CONSORT flow diagram of participant enrollment.
Figure 2. (A–D) Mean differences in depression and anxiety scores between the control and intervention groups at discharge and the 6-month follow-up. SAS, Self-Rating Anxiety Scale; SDS, Self-Rating Depression Scale. **p<.01. ***p<.001.
Figure 1.
Figure 2.
Impact of an integrated disease-specific nursing care model on parental anxiety and depression in severe hypospadias patients in China: a randomized controlled trial
| Characteristic | Control (n=93) | Intervention (n=87) | U | t | χ2 | pa) |
|---|---|---|---|---|---|---|
| Age (yr) | 5.3±2.93 | 5.3±3.07 | 3967 | .822b) | ||
| Meatal location | 2.55 | .466 | ||||
| Glans | 21 (22.6) | 13 (14.9) | ||||
| Penile | 51 (54.8) | 57 (65.5) | ||||
| Penoscrotal | 17 (18.3) | 13 (14.9) | ||||
| Perineal | 4 (4.3) | 4 (4.6) | ||||
| Parent education level | 0.64 | .887 | ||||
| Junior high school or below | 12 (12.9) | 8 (9.2) | ||||
| Senior high school | 50 (53.8) | 48 (55.2) | ||||
| Undergraduate | 24 (25.8) | 24 (27.6) | ||||
| Graduate | 7 (7.5) | 7 (8.0) | ||||
| Residence | 0.06 | .808 | ||||
| Urban | 68 (73.1) | 65 (74.7) | ||||
| Rural | 25 (26.9) | 22 (25.3) | ||||
| Baseline SAS | 56.90±6.11 | 58.54±6.31 | 1.77 | .079 | ||
| Baseline SDS | 58.13±6.23 | 56.92±7.41 | 1.19 | .236 |
| Variable | Control (n=93) | Intervention (n=87) | U | t | χ2 | pa) |
|---|---|---|---|---|---|---|
| Surgery type | 0.05 | .829 | ||||
| Single-stage | 76 (81.7) | 70 (80.5) | ||||
| Double-stage | 17 (18.3) | 17 (19.5) | ||||
| No. of operations | 0.01 | .910 | ||||
| 1 | 85 (91.4) | 80 (92.0) | ||||
| 2 | 8 (8.6) | 7 (8.0) | ||||
| Perioperative complications | 30 (32.3) | 25 (28.7) | 0.26 | .608 | ||
| Complications at follow-up | 14 (15.1) | 7 (8.0) | 2.14 | .143 | ||
| Discharge | ||||||
| SAS | 53.71±5.43 | 51.77±5.30 | 2.42 | .016 | ||
| SDS | 55.24±5.82 | 52.69±6.05 | 2,976 | .005b) | ||
| Follow-up | ||||||
| SAS | 52.06±5.09 | 46.36±5.12 | 1,560 | <.001b) | ||
| SDS | 53.40±5.06 | 49.46±5.42 | 2,144 | <.001b) |
| Time | Mean difference in SAS score between intervention and control groups | Mean difference in SDS score between control and intervention groups | ||||
|---|---|---|---|---|---|---|
| Mean (95% CI) | t | pa) | Mean (95% CI) | t | pa) | |
| Admission | –1.64 (–3.27 to –0.003) | –1.95 | .050 | 1.21 (–0.56 to 2.98) | 1.39 | .179 |
| Discharge | 1.94 (0.31 to 3.57) | 2.34 | .020 | 2.55 (0.78 to 4.31) | 2.83 | .005 |
| Six-month follow-up | 5.71 (4.07 to 7.34) | 6.79 | <.001 | 3.94 (2.17 to 5.71) | 4.33 | <.001 |
| Group | Mean decrease between admission and discharge | Mean decrease between discharge and 6-month follow-up | ||||
|---|---|---|---|---|---|---|
| Mean (95% CI) | t | pa) | Mean (95% CI) | t | pa) | |
| Control (SAS) | 3.19 (1.23 to 5.16) | 3.19 | <.001 | 1.65 (–0.32 to 3.61) | 1.65 | .134 |
| Control (SDS) | 2.89 (0.77 to 5.02) | 2.67 | .003 | 1.84 (–0.29 to 3.96) | 1.7 | .114 |
| Intervention (SAS) | 6.77 (4.74 to 8.80) | 6.54 | <.001 | 5.41 (3.38 to 7.45) | 5.22 | <.001 |
| Intervention (SDS) | 4.23 (2.03 to 6.43) | 3.77 | <.001 | 3.23 (1.03 to 5.43) | 2.88 | .001 |
Table 1. Baseline characteristics of children with hypospadias and their parents
Values are presented as mean±standard deviation or number (%). SAS, Self-Rating Anxiety Scale; SDS, Self-Rating Depression Scale. a)The chi-square test was used for categorical variables and the Student t-test was used for continuous variables unless otherwise stated. b)By Mann-Whitney U test.
Table 2. Treatment outcomes, postoperative complications, and parental SAS/SDS scores
Values are presented as number (%) or mean±standard deviation. SAS, Self-Rating Anxiety Scale; SDS, Self-Rating Depression Scale. a)The chi-square test was used to compare categorical variables and the Student t-test was used to compare numerical variables unless otherwise indicated. b)By Mann-Whitney U test.
Table 3. Post-hoc comparison of anxiety and depression scores between intervention and control groups at each time point
CI, confidence interval; SAS, Self-Rating Anxiety Scale; SDS, Self-Rating Depression Scale. a)Adjustment for multiple comparisons: Bonferroni.
Table 4. Post-hoc comparison of within-group changes in anxiety and depression scores over time
CI, confidence interval; SAS, Self-Rating Anxiety Scale; SDS, Self-Rating Depression Scale. a)Adjustment for multiple comparisons: Bonferroni.

