Skip Navigation
Skip to contents

J Korean Acad Nurs : Journal of Korean Academy of Nursing


Articles

Page Path
HOME > J Korean Acad Nurs > Ahead-of print articles > Article
Research Paper
Effect of a continuous glucose monitoring-guided personalized lifestyle coaching intervention on glycemic outcomes and variability in patients with type 2 diabetes mellitus: a randomized controlled trial
Youngran Yang1,2orcid, Youngmin Park3orcid, Heung Yong Jin4orcid

DOI: https://doi.org/10.4040/jkan.26036
Published online: August 12, 2026

1Research Institute of Nursing Science, College of Nursing, Jeonbuk National University, Jeonju, South Korea

2Biomedical Research Institute, Jeonbuk National University Hospital, Jeonju, South Korea

3Department of Food and Nutrition, Jeonbuk National University, Jeonju, South Korea

4Division of Endocrinology and Metabolism, Department of Internal Medicine, Jeonbuk National University Medical School, Jeonju, South Korea

Corresponding author: Youngran Yang College of Nursing, Research Institute of Nursing Science, Jeonbuk National University, Biomedical Research Institute, Jeonbuk National University Hospital, 567 Baekje-daero, Deokjin-gu, Jeonju 54896, South Korea E-mail: youngran13@jbnu.ac.kr
• Received: March 12, 2026   • Revised: April 21, 2026   • Accepted: June 24, 2026

© 2026 Korean Society of Nursing Science

This is an Open Access article distributed under the terms of the Creative Commons Attribution NoDerivs License (http://creativecommons.org/licenses/by-nd/4.0) If the original work is properly cited and retained without any modification or reproduction, it can be used and re-distributed in any format and medium.

  • 209 Views
  • 7 Download
  • Purpose
    This study examined the effects of continuous glucose monitoring (CGM)-guided personalized lifestyle coaching on glycemic outcomes and glycemic variability in patients with type 2 diabetes mellitus (T2DM).
  • Methods
    This three-arm randomized controlled trial was conducted in South Korea from June 2023 to November 2024. Participants were assigned to CGM alone (Intervention I, n=34), CGM-guided personalized lifestyle coaching (Intervention II, n=34), or standard diabetes education (control, n=34). The intervention lasted 3 months, with assessments at baseline and at 3, 6, and 12 months. Data were analyzed using generalized estimating equations.
  • Results
    At 3 months, glycated hemoglobin (HbA1c) and fasting plasma glucose (FPG) levels were significantly lower in both intervention groups than in the control group. Compared with the control group, HbA1c was lower by 0.78 percentage points in Intervention I (p=.008) and by 1.12 percentage points in Intervention II (p<.001). At 3 months, FPG was lower than in the control group by 34.05 mg/dL in Intervention I (p=.001) and by 34.77 mg/dL in Intervention II (p<.001). At 6 months, TBR70 (time below range <70 mg/dL) was lower in Intervention I than in Intervention II (adjusted mean difference=–2.18, p=.010), whereas TAR180 (time above range >180 mg/dL) was lower in Intervention II than in the control group and Intervention I by 7.85 and 8.28 percentage points, respectively (both p=.004).
  • Conclusion
    CGM-guided personalized lifestyle coaching improved glycemic control and reduced hyperglycemic exposure in patients with T2DM. Real-time glucose data may support individualized lifestyle counseling and sustained diabetes self-management.
    This study was registered with the Clinical Research Information Service (CRIS) of the Republic of Korea (KCT0008872) on 16 October 2023.
Recent data indicate that the global prevalence of diabetes has reached 14% among adults, with a substantial increase in healthcare costs, highlighting the growing burden of the disease [1,2]. Optimal glycemic control and reduced glucose variability are essential for preventing diabetes-related complications and mortality [3,4]. Adherence to healthy lifestyle behaviors, including diet and physical activity, plays a critical role in improving glycemic outcomes and reducing mortality risk among patients with diabetes [5,6]. However, despite these well-established benefits, a high proportion of patients with type 2 diabetes mellitus (T2DM) continue to exhibit poor glycemic control, with reported prevalence ranging from 45.2% to 93% [7]. This suggests that conventional approaches, such as standard diabetes education and general lifestyle recommendations, may be insufficient to achieve sustained glycemic control in real-world settings.
Adherence to healthy lifestyle habits, including diet and exercise, is key to glycemic control and prevention of diabetic complications [5]. Practicing healthy lifestyle habits, including physical activity, a healthy diet, maintaining normal weight, and abstinence from smoking and drinking, showed a 57% decrease in all-cause mortality among patients with diabetes, with an additional 21% decrease in all-cause mortality for each healthy lifestyle habit practiced [6]. Previous studies have suggested that personalized lifestyle interventions for patients with T2DM, including individualized exercise training, nutritional counseling, and regular feedback, may improve glycemic outcomes compared with usual care [8,9]. In the study by Goyal Mehra et al. [9], a personalized multi-interventional approach, focusing on customized nutrition, progressive fitness, and lifestyle modification, resulted in substantial reductions in glycated hemoglobin (HbA1c) (1.9%), fasting blood sugar (62.2 mg/dL), and body weight (2.8 kg) among T2DM patients. Recent evidence demonstrates that technology-driven intervention, such as digital twin, significantly reduce glucose variability [10].
Many studies have validated the benefits of continuous glucose monitoring (CGM)-guided lifestyle interventions that enable patients to track their blood glucose levels without repeated needle usage. Compared to traditional blood glucose self‐monitoring, CGM usage improves patients’ overall health status, with real-time blood glucose feedback influencing behavioral changes in diet and exercise [11]. These lead to positive changes, including reduced carbohydrate intake, increased physical activity, and improved self-efficacy, which are effective in promoting weight loss and reducing HbA1c levels.
Recent studies emphasize that the core of precision medicine is “data-based, customized education and counseling” [12]. Combining CGM usage with patient-targeted coaching results in effective glycemic control, improved lifestyle habits, weight loss, and quality of life improvement [13]. Zeevi et al. [14] analyzed blood glucose responses to 46,898 meals in 800 patients with diabetes and found variability in postprandial blood glucose levels even after similar meals, highlighting the need for personalized nutritional guidance.
Although previous studies have demonstrated the effectiveness of CGM, a meta-analysis of randomized controlled trials indicates that most studies have relatively short intervention durations, highlighting the need for longer-term investigations [11]. Long-term follow-up studies (≥1 year) examining CGM-guided behavioral interventions in patients with T2DM are still scarce. In addition, evidence integrating CGM data with personalized lifestyle interventions remains limited, particularly with respect to the added value of coaching beyond CGM use alone. While CGM has been shown to improve glycemic control by increasing patients’ awareness of glucose patterns, its effectiveness may be constrained when not accompanied by structured behavioral support. Recent studies have highlighted the potential benefits of combining CGM with personalized coaching; for example, Park et al. [15] demonstrated that real-time CGM integrated with individualized digital health coaching resulted in greater improvements in glycemic control and lifestyle behaviors compared with CGM alone. However, few studies have employed rigorous designs that allow direct comparison between standard care, CGM alone, and CGM combined with personalized coaching. Therefore, this three-arm randomized controlled trial aimed to evaluate the long-term effects of a CGM-guided personalized lifestyle coaching intervention on glycemic outcomes and variability in patients with T2DM.
1. Study design and setting
This prospective, single-center, parallel, three-arm randomized controlled trial (RCT) was conducted at a tertiary hospital in Jeonbuk Province, South Korea. Recruitment was conducted primarily at the tertiary hospital, with a small number of participants recruited through a primary care clinic; however, all participants were enrolled, provided informed consent, underwent baseline assessment, and completed all study procedures at the tertiary hospital.
2. Participant eligibility
Participants were eligible for inclusion if they were adults aged between 20 and 80 years, had been diagnosed with T2DM for at least 6 months, had a HbA1c level of ≥6.5%, owned a smartphone, had no prior experience using CGM, and were able to provide voluntary informed consent. Participants were excluded if they had a history of psychiatric illness, severe comorbidities requiring active treatment (e.g., diabetic kidney failure), recent surgery within the past year, a diagnosis of cancer within the past 5 years, a history of organ transplantation, receipt of diabetes-related education or counseling within the past 6 months, or recent changes in antidiabetic medication within the past 3 months.
3. Sample size calculation
This study’s minimum sample size was determined using the generalized estimating equation (GEE) model, suitable for repeated measures design utilizing CGM data. The estimation assumed a two-sided significance level of .05, power of .85, and exchangeable working correlation coefficient of .55. For sensitivity calculations, 92 participants were needed to detect a medium effect size (d=.50) [16]. To account for potential data loss and participant attrition during the study period, a conservative 10% dropout rate was applied [17]. Consequently, the total number of participants was set at 102, to ensure sufficient statistical power for the final analysis.
4. Participant recruitment
Participants were recruited from the Department of Endocrinology and Metabolism of Jeonbuk National University Hospital and a collaborating internal medicine clinic. Posters regarding the study, displayed in the outpatient clinics, as well as brief introduction by research staff during outpatients, provided information to potential participants.
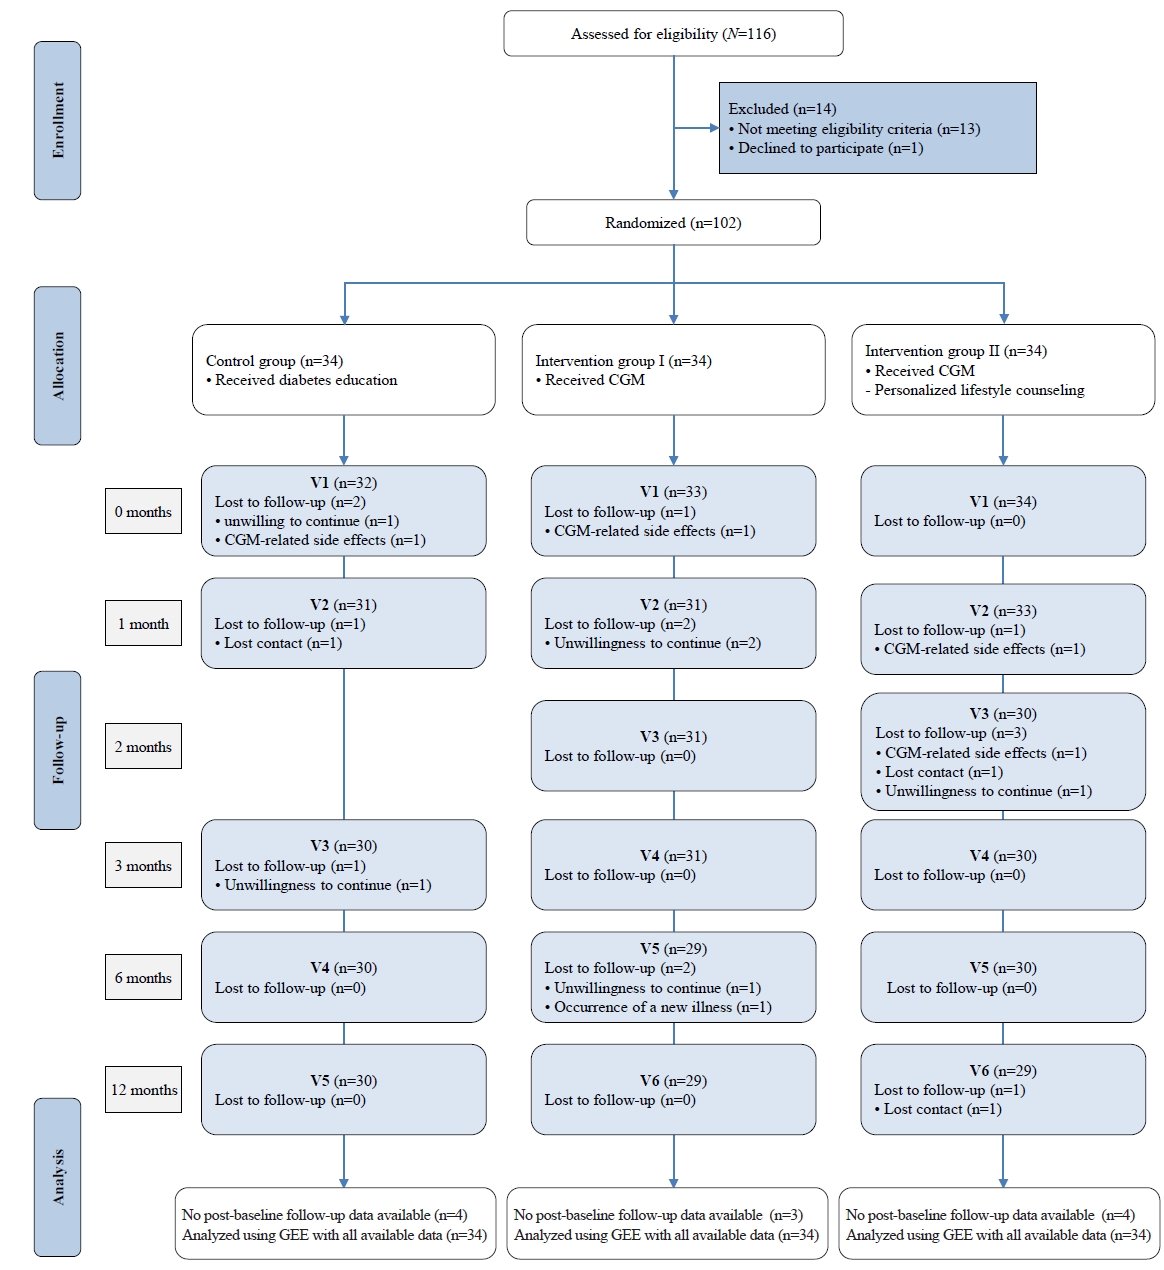
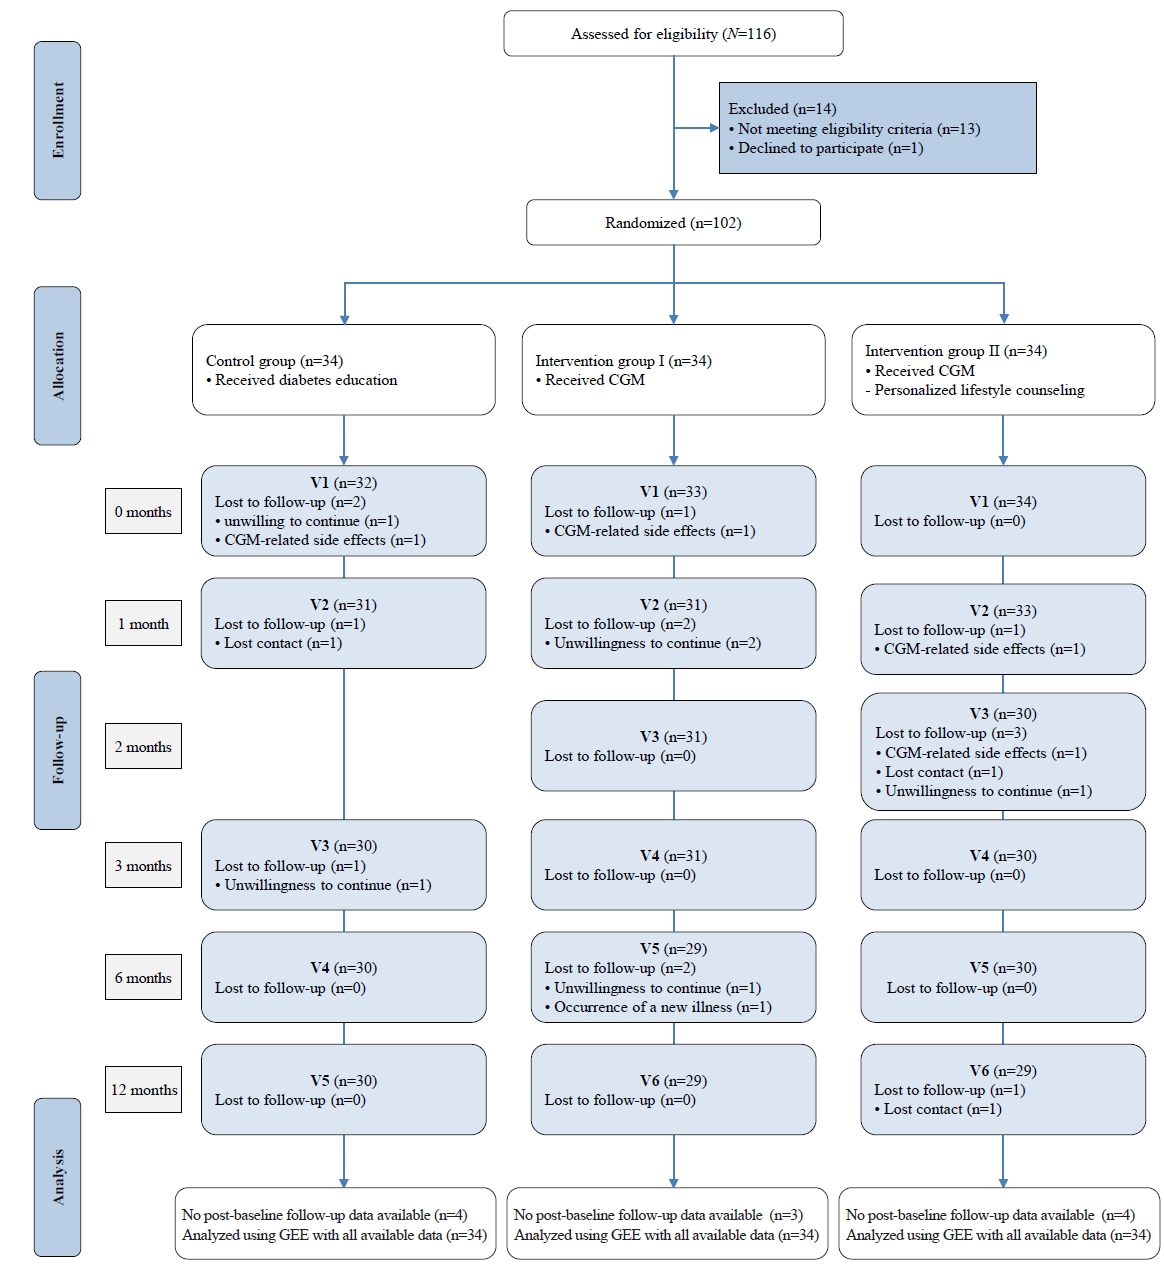
As shown in Figure 1, of the 116 individuals assessed for eligibility, 102 participants were randomized. Baseline characteristics were summarized for all 102 randomized participants. Participant recruitment occurred from June 12 to December 7, 2023, and follow-up concluded on November 11, 2024. The trial was completed as planned and was not stopped early.
5. Randomization and blinding
Participants were randomly assigned in a 1:1:1 ratio to the control, Intervention I, or Intervention II after eligibility confirmation, written informed consent, and completion of baseline assessment. Simple randomization was used without blocking, stratification, or other restrictions. Before participant enrollment, an independent third party who was not involved in the study generated the random allocation sequence using a computer-based random-number generator with a prespecified seed. The principal investigator retained the allocation list, and designated research staff implemented group assignment sequentially according to the pre-generated allocation sequence. Because the principal investigator had access to the allocation list, allocation concealment was limited; however, the allocation sequence was generated in advance and applied sequentially according to the order of enrollment.
The nature of the interventions, including CGM use and personalized coaching, made blinding of participants or researchers to group assignments impossible, thus preventing double-blinding. Although complete blinding of outcome assessors and data-processing personnel was not feasible, outcome measurements were conducted using standardized procedures and objective measurement devices to minimize detection bias, as described in Section 7.
6. Intervention
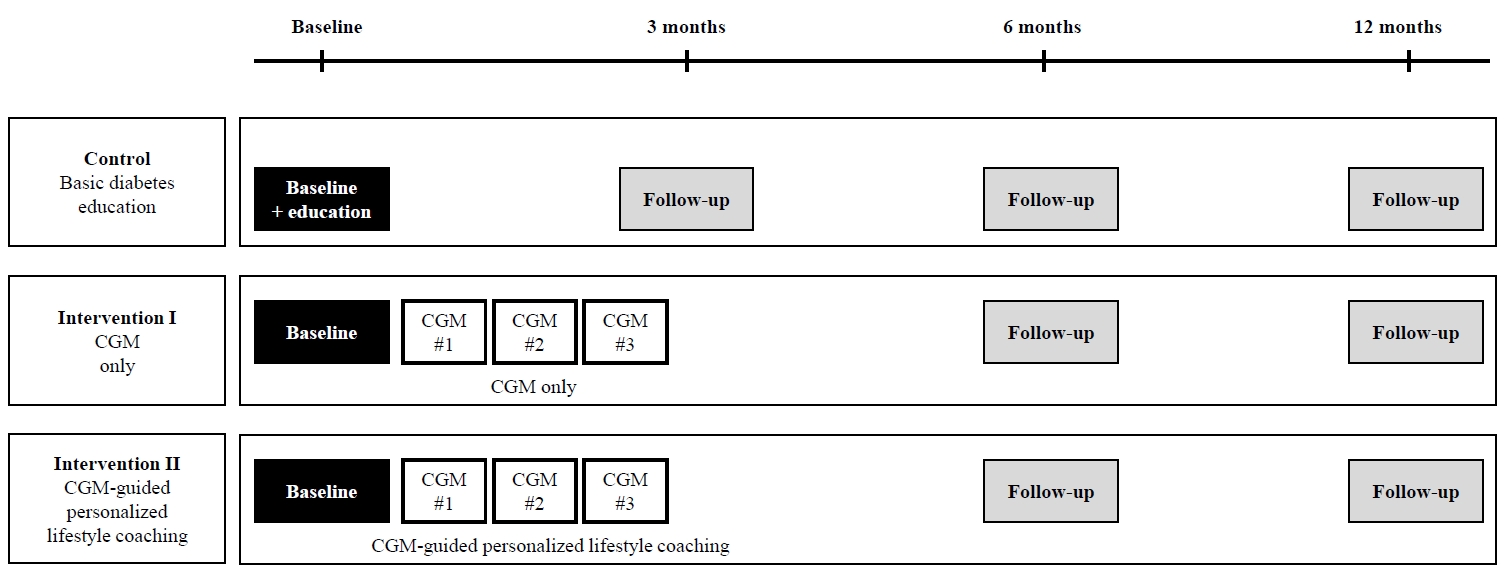
The intervention arm was subdivided into Intervention I and Intervention II, and both groups received their respective interventions over a three-month period (Figure 2). Participants continued their usual diabetes care and medications during the trial, and no additional structured diabetes education other than the assigned intervention was provided by the research team.

1) Intervention I

Intervention I received three CGM (FreeStyle Libre, Abbott Diabetes Care) systems along with standardized, face-to-face basic diabetes education over the 3-month intervention period. The educational content was developed by the research team based on established clinical guidelines for CGM use and interpretation [18], including the standardized ambulatory glucose profile (AGP) framework and international consensus recommendations. Education was delivered by nurse researchers who had completed a CGM training workshop. Participants were instructed on the fundamental principles and proper use of the CGM system, as well as on interpreting AGP reports. Using AGP graphs, they were guided to understand glycemic patterns, adjust lifestyle behaviors, and interpret the clinical significance of the glucose management indicator (GMI) in relation to HbA1c, consistent with prior CGM-based behavioral intervention studies.

2) Intervention II

Participants allocated to Intervention II received three CGM (Libre) systems along with 12 sessions (three face-to-face and nine non–face-to-face) over the 3-month intervention period. The CGM-guided personalized lifestyle coaching program was structured as a multi-stage, iterative intervention that integrated repeated assessments, individualized feedback, and behavioral reinforcement. It was delivered collaboratively by a clinical nutritionist with 30 years of experience in diet counseling at a university-affiliated hospital and by nurse research team members. The nurse research team members supported CGM use, monitored participants’ self-management behaviors, reinforced individualized goals, and provided ongoing coaching. The intervention providers were selected based on clinical experience in diabetes education, CGM use, diet counseling, and self-management support.
Before each weekly in-person coaching session, the research team carefully reviewed and evaluated the AGP of the CGM, body composition test results, daily dietary records, daily step counts, and sleep duration and patterns. Based on these assessments, the research team developed individualized diabetes dietary guidelines, including dietary diagnoses, recipes, food purchasing and ingredient recommendations, exercise instructions, sleep guidance, and glucose-target setting. The dietary coaching provided to the Intervention II participants was highly individualized, with meals analyzed based on postprandial blood glucose responses to allow adjustments within each participant’s acceptable range. Basic meal guidelines were based on the glycemic index and glycemic load. A meal plan developed using a food exchange list for six food groups was provided, along with education on low-sugar cooking methods and recipes for participants and their spouses, who were advised to prepare and consume three home-cooked meals per day. Exercise recommendations were provided in detail: ≥30–60 minutes of walking, cycling, or aerobics 5 times per week, and at least 10 minutes of resistance exercise twice per week, a minimum of 6,000 steps per day. When pre-exercise blood glucose level was ≤100 mg/dL, participants were instructed to consume carbohydrate-containing foods (e.g., 180 mL milk) before exercising and to carry candy during physical activity. Participants were encouraged to begin sleeping before 23:00 and to obtain at least 6 hours of sleep per night. Non–face-to-face counseling was conducted via phone calls, text messages, character drawing cards, emoticons, and simple notification service media.
As detailed in Supplementary Table 1, the intervention consisted of three sequential stages, each comprising (1) comprehensive assessment of CGM-derived glucose patterns, dietary intake, physical activity, and sleep; (2) individualized diagnosis of lifestyle-related glycemic issues; and (3) tailored intervention strategies, including personalized dietary planning, exercise guidance, and lifestyle modification. A key feature of the program was the use of real-time CGM data to provide immediate, personalized feedback linking lifestyle behaviors with glycemic responses. This approach enabled participants to iteratively adjust their behaviors through stepwise goal setting and continuous monitoring. Intervention delivery was monitored using session records, CGM replacement schedules, and participant contact logs to ensure that the interventions were delivered as planned.

3) Control group

Participants in the control group received in-person, standardized, basic diabetes education on an individual basis for 30 minutes.
7. Outcome measures and collection
Data collection schedule at baseline, 3, 6, and 12 months across the three study groups (Figure 2).

1) Glycemic outcomes and variability

The primary outcome was the change in HbA1c levels. HbA1c levels were measured using a Standard Analyzer Afinion 2 Analyzer (Abbott Diagnostics). Fasting plasma glucose (FPG) was measured after an overnight fast using the StatStrip Glucose Hospital Meter (Nova Biomedical). All measurements were performed by trained research assistants, including a clinical nutritionist and senior nursing students, under the supervision of the principal investigator. Measurement procedures were standardized and documented based on device-specific manufacturer manuals. Prior to data collection, all personnel completed structured training, including one-on-one practice sessions and competency verification through repeated measurements. To ensure reliability, quality control procedures were implemented, including duplicate measurements for a subset of participants, and periodic cross-checking of results among research staff.
To obtain other glycemic outcomes and variability, all participants wore the CGM device (FreeStyle Libre, Abbott Diabetes Care) after receiving comprehensive instructions on its correct use. The participants were advised to limit strenuous physical activity, avoid sweating, monitor the insertion site for any irritation or allergic reactions, and promptly report any adverse effects to the investigator. At the end of the active period of the sensor, the investigator removed the device and examined the skin for any adverse conditions. Throughout the procedure, participants were encouraged to ask questions and practice using the device to enhance their knowledge and confidence. Harms were defined as any unintended events related to CGM use or intervention participation, including skin irritation, allergic reaction, discomfort, symptomatic hypoglycemia, or other participant-reported adverse effects. These were assessed at each contact and recorded by the research team.
After each 2-week CGM wear period, data were retrieved from https://www.libreview.com. CGM data completeness was assessed based on the percentage of valid sensor data, with ≥70% of expected readings over the 14-day monitoring period required for inclusion. The mean scan adherence rate was 91.8%, indicating high compliance and minimal data loss. To ensure data accuracy, CGM measurements were interpreted according to standardized guidelines. Participants were instructed to confirm symptomatic hypoglycemia using capillary blood glucose measurements when necessary, and data were reviewed for implausible values and sensor errors prior to analysis.
Glycemic outcomes included time in range (TIR; 70–180 mg/dL), time above range >180 mg/dL (TAR180), time above range >250 mg/dL (TAR250), time below range <70 mg/dL (TBR70), time below range <54 mg/dL (TBR54), mean CGM-derived glucose, GMI, CGM-detected hypoglycemic events, and coefficient of variation (CV), which was used as an indicator of glycemic variability [19].

2) General characteristics

To identify participants’ characteristics, data were collected on socioeconomic factors (sex, age, education, cohabitation, employment, type of work, household income, and type of health insurance), diabetes-related factors (duration of diabetes, history of diabetes-related hospitalization, and complications), and treatment and management factors (medication use, diabetes management practices, and frequency of self-monitoring of blood glucose).
8. Statistical analysis
Baseline homogeneity among the three groups was examined using the chi-square test for categorical variables and analysis of variance for continuous variables. To evaluate changes in outcome variables over time and differences between groups, GEE were applied. Missing repeated-measure outcome data were handled within the GEE framework using all available data; no additional imputation was performed. For each outcome, the appropriate distribution and link function (Gamma distribution or log link function) were selected based on skewness, kurtosis, and model-fit indices, including the quasi-likelihood under the independence model criterion (QIC) and the corrected QIC.
Estimated marginal means were computed for each group at 3, 6, and 12 months. Pairwise comparisons were conducted using the least significant difference method, with the control group and baseline serving as the reference categories. To examine the overall pattern of group differences over time, a group × time interaction term was included in the GEE model. For variables with over-dispersion, such as the CGM-detected hypoglycemic events, a negative binomial distribution was adopted. No subgroup or sensitivity analyses were prespecified or performed. All analyses were conducted using IBM SPSS Statistics for Windows ver. 21.0 (IBM Corp.). No interim analyses or stopping guidelines were planned because this was a low-risk behavioral intervention trial with a fixed intervention period.
9. Ethical consideration and registry
The Institutional Review Board (IRB) of Jeonbuk National University Hospital approved this study on May 25, 2023 (IRB No. 2023-03-046-016). No important changes to the trial protocol, prespecified outcomes, or planned analyses were made after trial commencement. Informed consent was obtained from all participants. This study was retrospectively registered with the Clinical Research Information Service of Korea (CRIS; KCT0008872) on 16 October 2023. The study was reported in accordance with the Consolidated Standards of Reporting Trials (CONSORT) 2025 statement for parallel-group randomized trials [20]. Patients or members of the public were not involved in the design, conduct, reporting, or dissemination plans of this study.
1. Participant characteristics
The overall sex distribution was 52.9% male and 47.1% female, and the mean age was 58.3 years (standard deviation [SD]=10.6 years). Of the participants, 46.1% had a high school diploma or below, while 53.9% had a college degree or higher; 80.4% of participants were living together with family. Regarding employment status, 71.6% of participants were employed; among the employed participants, the majority (91.8%) were engaged in regular work. Household income was <2,000,000 Korean won (KRW) for 21.6% of the participants, 2,000,000–3,999,999 KRW for 33.3%, and ≥4,000,000 KRW for 45.1%. The health insurance enrollment rate was 94.1%. Mean duration of diabetes was 14.6 years (SD=10.4 years), and only 3.0% of participants had experienced diabetes-related education within the last 6 months. Diabetes-related complications or comorbidities occurred in 34.3% of patients, and 38.2% had previously heard about CGM (Table 1). During the study period, no serious intervention-related adverse events were reported.
2. Baseline characteristics and group homogeneity
The three groups were homogeneous at study commencement in terms of demographic, clinical, and lifestyle-habit-related characteristics (Table 1).
3. Differences of outcomes among groups
At 3 months, both Intervention I and Intervention II demonstrated significant improvements in glycemic outcomes compared with the control group. HbA1c decreased by 0.78% (standard error [SE]=0.29, p=.008) in the Intervention I and by 1.12% (SE=0.27, p<.001) in the Intervention II relative to controls, representing clinically meaningful improvements in glycemic control (Table 2). The GEE model further confirmed significant group × time interaction effects for HbA1c (Wald χ2=13.53, p=.035), with the greatest reduction observed at 3 months in the Intervention II (B=−0.11, SE=0.04, p=.003) (Table 3).
Similarly, FPG declined markedly at 3 months in the Intervention I (adjusted mean difference [MD]=34.05 mg/dL, p=.001; B=−0.28, SE=0.09, p=.003). Mean CGM-derived glucose levels at 6 months were significantly lower in the Intervention II group compared with controls (adjusted MD=30.36 mg/dL, p=.002), consistent with a significant GEE interaction effect (Wald χ2=11.55, p=.041). The GMI also improved in the Intervention II (adjusted MD=0.73, p=.002 at 6 months), paralleling the reductions in mean CGM glucose. TIR significantly increased in the Intervention II at 6 months compared with controls (adjusted MD=−16.71, p=.002) and the Intervention I (adjusted MD=−14.07, p=.010), indicating clinically meaningful improvements in glycemic stability. At 6 months, TBR <70 mg/dL was significantly lower in the Intervention I than in the Intervention II (adjusted MD=−2.18, p=.010), and the Intervention II showed a further significant decrease at 12 months (B=−1.27, SE=0.53, p=.017; Wald χ2=30.54, p<.001). At 6 months, the proportion of TAR >180 mg/dL was lower in Intervention II than in the control group and Intervention I by 7.85 and 8.28 percentage points, respectively (both p=.004), supported by a marginally significant GEE interaction during the 3–6 month period (Wald χ2=9.94, p=.081).
The CV showed a downward trend across both intervention groups, with a statistically significant reduction at 12 months in the Intervention II (B=−0.10, SE=0.05, p=.037), reflecting improved within-day glucose stability. Similarly, CGM-detected hypoglycemic events showed a significant group × time inter action (Wald χ2=21.49, p<.001). Transient increases were observed at 6 months in Intervention I (B=2.46, SE=1.01, p=.014) and Intervention II (B=2.47, SE=1.01, p=.015), but these increases were no longer evident at 12 months.
This study demonstrated that a CGM-guided personalized lifestyle coaching intervention produced significant improvements in both glycemic control and glucose variability in patients with T2DM. At 3 months, both HbA1c and FPG showed substantial reductions in the Intervention I and Intervention II groups compared with the control group. In terms of glycemic variability, Intervention II showed lower TAR >180 mg/dL at 6 months than both the control group and Intervention I, whereas TBR <70 mg/dL was lower in Intervention I than in Intervention II. Overall, these findings suggest that CGM-guided personalized lifestyle coaching was more effective in reducing hyperglycemic exposure, while CGM alone was associated with lower hypoglycemic exposure at 6 months.
In meta-analyses of CGM effects, relative reductions in HbA1c were 0.17% [21], 0.20% [22], 0.31% [23], and 0.32% [11]; compared with these findings, CGM alone in our study produced a larger effect. Prior studies integrating CGM with personalized nutritional or artificial intelligence (AI)-based lifestyle coaching have reported greater HbA1c reductions than CGM alone, ranging from 0.41% to 1.10% over 12 months [24-27]. In this study, the reduction in HbA1c exceeded those reported in previous investigations. This suggests that personalized lifestyle coaching using CGM data may provide greater therapeutic benefits than glucose monitoring alone [27]. However, the effects were not maintained in the longer term (up to 12 months), indicating the need for continued intervention and sustained internalization of self-care behaviors. This temporal pattern of initial improvement followed by attenuation at 12 months may reflect the diminishing intensity of behavioral reinforcement after the active intervention period. A systematic review has shown that lifestyle and behavioral interventions often demonstrate the greatest effects during the active intervention phase, with gradual decline once structured support is withdrawn [21]. In the absence of ongoing support, adherence to lifestyle modifications may decrease over time, leading to partial loss of intervention effects. These findings suggest that CGM use and periodic reinforcement coaching may be important to support longer-term glycemic control.
This study demonstrated a significant 16.71% increase in TIR in the Intervention II compared with the control group at 6 months, as well as a 7.85% reduction in TAR>180 mg/dL. A recent meta-analysis of 20 RCTs evaluating CGM-based nutritional interventions by Bannuru et al. [24] reported a 7.18% increase in TIR and a 7.32% decrease in TAR>180 mg/dL, indicating that the current study achieved greater improvements. Previous studies have shown that TIR is closely associated with the risk of cardiovascular complications; a 10% increase in TIR is linked to a 24% reduction in microvascular complications [28], whereas a TIR below 50% increases all-cause mortality by 83% and cardiovascular disease mortality by 85% [29]. The American Diabetes Association recommends achieving a TIR of ≥70%. Thus, achieving higher TIR in the Intervention II over the study period may contribute to the long-term prevention of both microvascular and macrovascular complications. At 6 months, the hypoglycemic risk (TBR70) was significantly lower in the Intervention I relative to Intervention II (adjusted MD=−2.18, p=.010).
The superior outcomes in glucose control and variability in the Intervention II likely reflect the synergistic effect of real-time CGM data combined with 12 sessions of personalized coaching delivered by an expert clinical nutritionist with 30 years of experience in diabetes patient education and counseling in a university-affiliated hospital. Zeevi et al. [14] emphasized the need for personalized nutritional guidance due to substantial individual variability in postprandial glucose responses to identical foods. Applying this principle, the nutritionist in this study analyzed each participant’s CGM data, step count, nutritional intake, and sleep duration and quality every 2 weeks, and provided specific, actionable guidance. This guidance included recommendations on meal order (e.g., vegetables–protein–fat–grains), glycemic index–based food choices, and exercise timing, duration, and intensity [30]. Zahedani et al. [13] further supported our approach of integrating personalized wearable data and behavioral patterns to improve metabolic health.
Real-time CGM data serves as a behavioral modification tool for food selection and physical activity, enabling patients to recognize their glucose patterns and adopt healthier habits [10]. In this study, participants in the Intervention II received counseling on interpreting their glucose patterns using AGP reports and applying specific behavioral adjustments—for example, increasing aerobic exercise by 30% when postprandial glucose exceeded 160 mg/dL. Such feedback loops enhance self-efficacy and promote sustainable lifestyle change. Ferreira et al. [23] found that CGM alone is insufficient without professional education and support, aligning with the current finding that although the Intervention I group showed improvement, its effect size was smaller than that of the Intervention II.
A recent scoping review of 31 RCTs reported that CGM-based biofeedback interventions promoting behavioral change typically include core components such as feedback and monitoring, shaping knowledge, social support, and instruction on behavioral performance [31]. The Intervention II incorporated these same elements: goal setting (achieving TIR ≥70%), behavioral monitoring (biweekly AGP review), feedback (via text, phone call, and Social Networking Service), problem solving (strategies for postprandial glucose spikes and hypoglycemic events), and social support (consistent encouragement and reinforcement). Importantly, the intervention’s beneficial effects were partially sustained at 12 months, mainly for CV, while HbA1c effects attenuated over time, underscoring the need for periodic nurse-led reinforcement. This indicates durable behavioral change rather than short-term glycemic improvement. Factors contributing to this long-term success likely include biweekly in-person counseling during sensor replacement, immediate glucose visualization via the app, professional consultation, stepwise goal setting, and personalized feedback tailored to individual participant characteristics [32].
Ji et al. [33] emphasized that “data-driven personalized education and counseling” form the core of precision medicine in diabetes management by integrating clinical, lifestyle, genetic, and biomarker information. The Intervention II incorporated multidimensional data including 15-minute interval CGM data, dietary logs, step counts, activity levels, sleep patterns, blood pressure, and body composition into individualized coaching. Such data integration reflects the principles of emerging digital twin platforms [34]. A digital twin is an AI-based precision medicine tool that virtually replicates a patient’s physiological and metabolic state to predict individualized glucose responses and recommend optimal lifestyle combinations [35]. Shamanna et al. [36] reported that the Twin Health platform, which integrates CGM with multimodal data, achieved an additional 1.4% reduction in HbA1c, a 26% increase in TIR, and a 34% reduction in cardiovascular risk over 1 year. The 12-month follow-up data from this study can serve as training data for machine learning models to predict individual glucose responses to diet, exercise, and sleep. The comparison between Interventions I and II offers a valuable benchmark for evaluating the added contribution of human expertise to AI algorithms.
Future studies should build on the current findings by further refining CGM-guided personalized lifestyle interventions. Longitudinal CGM data may be used to identify individual glucose response patterns and to optimize the timing, frequency, and content of lifestyle coaching. Future research should examine strategies to sustain long-term intervention effects, such as periodic reinforcement, adaptive feedback, and tailored follow-up programs. These approaches may enhance the durability and scalability of personalized diabetes self-management interventions.
The main strengths of this study include its three-arm randomized controlled design, which enabled systematic comparison of CGM alone versus CGM plus personalized coaching. Although data completeness and measurement accuracy were high, intermittent scanning CGM systems may still be subject to data gaps if scans are not performed within the required intervals. Although blinding of participants and providers was not feasible due to the nature of the intervention, this may have introduced performance bias. Differences in the intensity of contact and participant engagement between groups, especially the more frequent and personalized interactions in Intervention II, may have contributed to improved adherence and behavioral changes independent of the intervention content itself. To mitigate potential detection bias, outcome assessments were based on objective clinical measures, including HbA1c and FPG, obtained using standardized devices and protocols. Data collection and processing followed predefined protocols, and outcome data were handled consistently across groups to ensure comparability. Recruitment from a single region limits generalizability, and the inherent nature of CGM and coaching interventions makes blinding of providers infeasible, introducing potential performance bias. Future research should involve multicenter, nationwide RCTs to confirm these effects and conduct cost-effectiveness analyses to evaluate the economic feasibility of CGM-based personalized interventions [11]. In terms of generalizability, the findings of this study may be most applicable to middle-aged and older adults with T2DM who are capable of using smartphone-based CGM systems and engaging in structured lifestyle interventions. The intervention was delivered within a healthcare setting with access to experienced clinical professionals, which may limit its applicability to resource-constrained environments.
This study demonstrated that CGM-based personalized lifestyle coaching is an effective strategy for patients with T2DM, with its effects on glucose variability partially sustained at 12 months. Diabetes nurse specialists can strengthen patients’ self-management capacity and prevent complications by developing and delivering individualized education programs that utilize CGM data. Comprehensive approaches that integrate multiple lifestyle factors, including nutrition, exercise, sleep, and medication information, are essential, and real-time feedback combined with continuous professional support plays a pivotal role in sustaining behavioral change. This RCT provides evidence that CGM-based personalized coaching can achieve substantial improvements in diabetes management and suggests that enhancing glycemic stability contributes meaningfully to the prevention of long-term complications. The findings also provide a basis for advancing digital twin–based approaches in precision diabetes care.

Conflicts of Interest

No potential conflict of interest relevant to this article was reported.

Acknowledgements

We sincerely thank all participants who generously contributed their time and effort to this study.

Funding

This research was supported by the Ministry of Education of the Republic of Korea and the National Research Foundation of Korea (NRF) 2021 (Grant No. 2021R1A2C2092656). The funder had no role in the study design, data collection, analysis, interpretation, manuscript preparation, or decision to submit the manuscript for publication.

Data Sharing Statement

The trial protocol, statistical analysis plan, de-identified participant data, data dictionary, and statistical code are available from the corresponding author upon reasonable request, subject to institutional and ethical approval.

Supplementary Data

Supplementary data to this article can be found online at https://doi.org/10.4040/jkan.26036.

Supplementary Table 1.

jkan-26036-Supplementary-Table-1.pdf

Author Contributions

Conceptualization: YY, YP, HYJ. Methodology: YY, HYJ. Software: none. Validation: none. Formal analysis: YY. Investigation: YY, YP, HYJ. Resources: none. Data curation: YY, YP. Visualization: none. Supervision: YY. Project administration: YY, YP. Funding acquisition: YY. Writing–original draft: YY. Writing–review & editing: YP, HYJ. Final approval of the manuscript: all authors.

Fig. 1.
Flowchart of participant selection. CGM, continuous glucose monitoring; V, visit. Note. The number of observations included in the GEE analyses varied by outcome and time point.
jkan-26036f1.jpg
Fig. 2.
Intervention flow and data collection schedule across the three study groups at baseline, 3 months, 6 months, and 12 months. Participants were assigned to one of three groups: the Control group received basic diabetes education at baseline only; Intervention I received continuous glucose monitoring (CGM) administered 3 consecutive times during the first 3 months; and Intervention II received the CGM-guided personalized lifestyle coaching delivered concurrently with the CGM sessions. All three groups completed identical follow-up assessments at 3, 6, and 12 months.
jkan-26036f2.jpg
Table 1.
Baseline characteristics of randomized participants
Characteristic Total Control Intervention I Intervention II χ2/F (p)
Sex 2.13 (.346)
 Male 54 (52.9) 15 (44.1) 18 (52.9) 21 (61.8)
 Female 48 (47.1) 19 (55.9) 16 (47.1) 13 (38.2)
Age (yr) 58.3±10.6 56.4±11.4 58.5±9.0 59.9±11.1 0.96 (.387)
Education level 4.10 (.128)
 High school or less 47 (46.1) 11 (32.4) 19 (55.9) 17 (50.0)
 College or more 55 (53.9) 23 (67.6) 15 (44.1) 17 (50.0)
Living situation 0.87 (.647)
 With family 82 (80.4) 29 (85.3) 27 (79.4) 26 (76.5)
 Alone 20 (19.6) 5 (14.7) 7 (20.6) 8 (23.5)
Employment 2.41 (.300)
 Yes 73 (71.6) 26 (76.5) 26 (76.5) 21 (61.8)
 No 29 (28.4) 8 (23.5) 8 (23.5) 13 (38.2)
Working type (among employed participants, n=73) 0.07 (.967)
 Regular work 67 (91.8) 24 (92.3) 24 (92.3) 19 (90.5)
 Shift work 6 (8.2) 2 (7.7) 2 (7.7) 2 (9.5)
Household income (1,000 KRW) 1.44 (.838)
 <2,000 22 (21.6) 7 (20.6) 9 (26.5) 6 (17.6)
 2,000–<4,000 34 (33.3) 10 (29.4) 12 (35.3) 12 (35.3)
 ≥4,000 46 (45.1) 17 (50.0) 13 (38.2) 16 (47.1)
Health insurance 3.19 (.203)
 National health insurance 96 (94.1) 33 (97.1) 30 (88.2) 33 (97.1)
 Medical aid 6 (5.9) 1 (2.9) 4 (11.8) 1 (2.9)
Diabetes duration (yr) 14.6±10.4 14.0±10.2 13.1±9.9 16.7±11.1 1.13 (.327)
Experience of hospital admission due to diabetes 3.97 (.138)
 Ever 12 (11.8) 5 (14.7) 6 (17.6) 1 (2.9)
 Never 90 (88.2) 29 (85.3) 28 (82.4) 33 (97.1)
Experience of receiving diabetes education in the past 6 months 0.00 (>.999)
 Ever 3 (3.0) 1 (2.9) 1 (3.0) 1 (3.0)
 Never 97 (97.0) 33 (97.1) 32 (97.0) 32 (97.0)
Diabetes complications/comorbidities 0.09 (.957)
 Present 35 (34.3) 11 (32.4) 12 (35.3) 12 (35.3)
 Absent 67 (65.7) 23 (67.6) 22 (64.7) 22 (64.7)
Ever heard of CGM 0.25 (.883)
 Ever 39 (38.2) 14 (41.2) 12 (35.3) 13 (38.2)
 Never 63 (61.8) 20 (58.8) 22 (64.7) 21 (61.8)
Glucose-lowering treatment 5.68 (.225)
 Insulin only 1 (1.0) 1 (2.9) 0 (0.0) 0 (0.0)
 Oral hypoglycemic agent plus insulin 18 (17.6) 6 (17.7) 9 (26.5) 3 (8.8)
 Oral hypoglycemic agent only 83 (81.4) 27 (79.4) 25 (73.5) 31 (91.2)
Frequency of SMBG 0.10 (.999)
 None 59 (57.8) 20 (58.8) 20 (58.8) 19 (55.9)
 Once a day 31 (30.4) 10 (29.4) 10 (29.4) 11 (32.3)
 Twice or more a day 12 (11.8) 4 (11.8) 4 (11.8) 4 (11.8)
Diabetes management (multiple responses)
 None 20 (19.6) 8 (23.5) 5 (14.7) 7 (20.6) 0.87 (.647)
 Diet 40 (39.2) 12 (35.3) 16 (47.1) 12 (35.3) 1.32 (.518)
 Exercise 71 (69.6) 23 (67.6) 26 (76.5) 22 (64.7) 1.21 (.547)
 Health functional foods 21 (20.6) 7 (20.6) 8 (23.5) 6 (17.6) 0.36 (.835)
 Folk remedies 14 (13.7) 3 (8.8) 7 (20.6) 4 (11.8) 2.15 (.341)
Experience of hypoglycemia 0.15 (.929)
 Ever 16 (15.7) 5 (14.7) 5 (14.7) 6 (17.6)
 Never 86 (84.3) 29 (85.3) 29 (85.3) 28 (82.4)
FPG 149.2±47.4 151.7±45.2 159.1±54.6 136.6±39.5 1.99 (.141)
HbA1c 8.2±1.3 8.4±1.1 8.1±1.3 8.1±1.4 0.58 (.563)
Time CGM active (%) 91.8±7.6 91.1±7.6 92.6±6.6 91.7±8.7 0.34 (.712)
Mean CGM-derived glucose levels (mg/dL) 177.8±38.6 187.5±35 178.1±44.2 168.1±34.9 2.16 (.120)
GMI (%) 7.6±0.9 7.8±0.8 7.6±1.1 7.3±0.8 2.18 (.118)
TIR 70–180 mg/dL (%) 60.4±21.8 54.1±20.9 61.7±22.6 65.4±20.9 2.44 (.093)
TBR <54 mg/dL (%) 0.04±0.20 0.03±0.17 0.03±0.18 0.06±0.24 0.22 (.802)
TBR <70 mg/dL (%) 0.5±1.5 0.5±1.5 0.4±1.1 0.6±1.9 0.16 (.852)
TAR >180 mg/dL (%) 24.7±10.7 28.3±10.7 23.3±10.4 22.7±10.4 2.84 (.063)
TAR >250 mg/dL (%) 14.3±15.7 17.1±14.5 14.6±19 11.2±13.3 1.19 (.310)
CV (%) 30.7±7.2 30.5±8.1 30.6±7.1 30.9±6.6 0.03 (.968)
CGM-detected hypoglycemic events 3.1±20.5 7.5±35.6 0.8±2.1 1.3±2.9 1.03 (.362)

Values are presented as number (%) or mean±standard deviation. Percentages may not total 100.0 because of rounding to one decimal place. Percentages for diabetes management variables were calculated separately for each item because multiple responses were allowed. For receipt of diabetes education within the previous 6 months, data were missing for two participants; percentages were calculated from available cases (n=100). For diabetes management, multiple responses were allowed; percentages were calculated separately for each item using N=102 for the total sample and n=34 for each study group and therefore do not sum to 100.0%.

CGM, continuous glucose monitoring; CV, coefficient of variation; FPG, fasting plasma glucose; GMI, glucose management indicator; HbA1c, glycated hemoglobin; KRW, Korean won; SMBG, self-monitoring of blood glucose; TAR, time above range; TBR, time below range; TIR, time in range.

Table 2.
Changes in glycemic outcomes and variability by group and time (by GEE)
Indicator Time Control Intervention I Intervention II Control vs. intervention I Control vs. intervention II Intervention I vs. intervention II
Mean±SE Mean±SE Mean±SE Adj. MD±SE p Adj. MD±SE p Adj. MD±SE p
HbA1c (%) Baseline 8.39±0.10 8.14±0.11 8.06±0.12 - - - - - -
3 mo 8.12±0.24 7.35±0.17 7.01±0.14 0.78±0.29 .008 1.12±0.27 <0.001 0.34±0.22 .127
6 mo 8.01±0.22 7.76±0.23 7.21±0.18 0.25±0.32 .432 0.80±0.29 .005 0.55±0.30 .064
12 mo 7.86±0.20 7.76±0.20 7.70±0.34 0.11±0.28 .699 0.16±0.39 .683 0.05±0.39 .892
FPG (mg/dL) Baseline 151.74±3.83 159.06±4.63 136.58±3.40 - - - - - -
3 mo 162.53±7.96 128.48±6.01 127.76±5.31 34.05±9.97 .001 34.77±9.57 <0.001 −0.73±8.02 .928
6 mo 149.47±5.55 153.62±8.50 133.79±9.58 −4.15±10.15 .682 15.67±11.07 .157 19.83±12.80 .121
12 mo 146.39±6.19 155.07±6.83 151.16±8.46 −8.68±9.22 .347 −4.77±10.48 .649 3.91±10.87 .719
Mean CGM glucose (mg/dL) Baseline 187.55±3.01 178.13±3.86 168.15±2.96 - - - - - -
3 mo - 163.63±5.38 147.69±4.32 - - - - 15.94±6.90 .021
6 mo 179.57±7.58 173.11±6.37 149.21±5.88 6.46±9.90 .514 30.36±9.60 .002 23.89±8.67 .006
12 mo 174.48±6.18 169.37±7.23 162.62±9.03 5.11±9.51 .591 11.87±10.94 .278 6.75±11.56 .559
GMI (%) Baseline 7.80±0.07 7.57±0.09 7.33±0.07 - - - - - -
3 mo - 7.22±0.13 6.84±0.10 - - - - 0.38±0.16 .022
6 mo 7.60±0.18 7.45±0.15 6.88±0.14 0.15±0.24 .520 0.73±0.23 .002 0.57±0.21 .006
12 mo 7.48±0.15 7.37±0.17 7.19±0.22 0.11±0.23 .611 0.29±0.27 .272 0.18±0.28 .528
TIR (%) Baseline 54.06±1.80 61.72±1.98 65.44±1.77 - - - - - -
3 mo - 68.30±3.50 79.21±3.13 - - - - −10.91±4.69 .020
6 mo 59.61±4.00 62.25±4.06 76.32±3.65 −2.64±5.70 .643 −16.71±5.41 .002 −14.07±5.45 .010
12 mo 59.93±3.68 64.78±4.12 73.08±4.18 −4.85±5.52 .380 −13.15±5.57 .018 −8.30±5.87 .157
TBR70 (%) Baseline 0.52±0.13 0.38±0.10 0.59±0.16 - - - - - -
3 mo - 2.00±0.69 2.17±0.68 - - - - −0.17±0.97 .864
6 mo 3.00±0.62 1.71±0.33 3.89±0.78 1.29±0.71 .069 −0.89±1.00 .372 −2.18±0.85 .010
12 mo 5.00±1.60 2.50±0.68 1.38±0.17 2.50±1.74 .152 3.63±1.61 .025 1.13±0.71 .111
TAR180 (%) Baseline 28.27±0.92) 23.25±0.90 22.71±0.88 - - - - - -
3 mo - 21.27±2.26 15.79±2.04 - - - - 5.47±3.04 .072
6 mo 25.11±1.77 25.54±2.07 17.26±2.05 −0.43±2.72 .875 7.85±2.71 .004 8.28±2.91 .004
12 mo 25.70±1.93 23.22±2.00 19.24±2.22 2.48±2.78 .372 6.46±2.94 .028 3.98±2.99 .183
TAR250 (%) Baseline 17.12±1.25 14.36±1.66 11.24±1.13 - - - - - -
3 mo - 10.82±2.10 8.19±1.64 - - - - 2.63±2.66) .323
6 mo 16.40±3.34 12.69±2.60 9.41±2.82 3.71±4.24 .381 6.99±4.37 .110 3.28±3.83) .392
12 mo 14.58±2.35 13.22±3.35 13.19±3.95 1.37±4.09 .739 1.39±4.60 .762 0.03±5.18) .996
CV (%) Baseline 30.46±0.69 30.58±0.62 30.90±0.56 - - - - - -
3 mo - 30.38±1.25 27.57±1.25 - - - - 2.81±1.76) .111
6 mo 30.98±1.30 30.30±1.09 29.28±1.37 0.68±1.69 .687 1.70±1.89 .368 1.02±1.75) .561
12 mo 31.52±1.55 30.23±1.23 28.81±1.43 1.29±1.97 .514 2.72±2.10 .197 1.43±1.88) .449
CGM-detected hypoglycemic events Baseline 7.45±6.30 0.81±0.36 1.28±0.51 - - - - - -
3 mo - 0.73±0.30 1.67±0.62 - - - - –0.93±0.69 .177
6 mo 1.11±0.45 1.43±0.57 2.27±0.64 –0.31±0.73 .668 –1.15±0.79 .142 –0.84±0.86 .330
12 mo 2.40±1.06 1.85±0.64 1.04±0.29 0.55±1.23 .657 1.36±1.09 .215 0.81±0.70 .280

Baseline values are unadjusted descriptive statistics; adjusted means at 3, 6, and 12 months were derived from generalized estimating equation models controlling for time, group, and group-by-time interaction effects. The control group and baseline were used as reference categories. The GEE model adjusted for repeated measures with robust SEs. Intervention Group I: CGM-alone; Intervention Group II: CGM-guided personalized coaching.

Adj. MD, adjusted mean difference; CV, coefficient of variation; FPG, fasting plasma glucose; GEE, generalized estimating equation; GMI, glucose management indicator; Mean CGM glucose, continuous glucose monitoring-derived mean glucose (14-day average); SE, standard error; TAR180, time above range 180 (>180 mg/dL); TAR250, time above range 250 (>250 mg/dL); TBR70, time below range 70 (<70 mg/dL); TIR, time in range (70–180 mg/dL).

Table 3.
Interaction effects of time and group on glycemic outcomes and variability
Outcome Time point (mo) B SE p Wald χ2 p
HbA1c (%) 13.53 .035
 Intervention I 3 –0.07 0.04 .052
6 0.00 0.04 .945
12 0.02 0.03 .599
 Intervention II 3 –0.11 0.04 .003
6 –0.07 0.04 .076
12 0.02 0.04 .633
FPG (mg/dL) 28.64 <.001
 Intervention I 3 –0.28 0.09 .003
6 –0.02 0.10 .841
12 0.01 0.07 .884
Intervention II 3 –0.14 0.07 .069
6 –0.01 0.08 .944
12 0.14 0.07 .049
Mean CGM glucose (mg/dL) 11.55 .041
 Intervention I 3 0.045 0.042 .285
6 0.015 0.043 .731
12 0.022 0.045 .628
 Intervention II 6 –0.076 0.046 .095
12 0.039 0.054 .473
GMI (%) 10.21 .069
 Intervention I 3 0.02 0.02 .341
6 0.01 0.02 .705
12 0.01 0.03 .571
Intervention II 6 -0.04 0.03 .121
12 0.02 0.03 .478
TIR (%) 7.26 .202
 Intervention I 3 –0.09 0.06 .113
6 –0.09 0.07 .231
12 –0.06 0.08 .481
 Intervention II 6 0.06 0.07 .435
12 0.01 0.08 .929
TBR70 (%) 30.54 <.001
 Intervention I 3 0.25 0.55 .649
6 –0.21 0.50 .672
12 –0.34 0.49 .484
 Intervention II 6 0.28 0.53 .596
12 –1.27 0.53 .017
TAR180 (%) 9.94 .081
 Intervention I 3 0.27 0.12 .019
6 0.21 0.10 .039
12 0.09 0.11 .379
 Intervention II 6 –0.16 0.12 .191
12 –0.07 0.13 .588
TAR250 (%) 2.39 .792
 Intervention I 3 0.01 0.32 .977
6 –0.13 0.23 .557
12 0.02 0.26 .928
 Intervention II 6 –0.16 0.32 .604
12 0.29 0.31 .342
CV (%) 9.05 .113
 Intervention I 3 0.11 0.05 .018
6 –0.03 0.04 .514
12 –0.05 0.04 .219
 Intervention II 6 –0.07 0.05 .170
12 –0.10 0.05 .037
CGM-detected hypoglycemic events 21.49 <.001
 Intervention I 3 –0.37 0.54 .496
6 2.46 1.01 .014
12 1.96 1.01 .052
 Intervention II 6 2.47 1.01 .015
12 0.93 1.09 .396

Regression coefficients represent changes from baseline within each group. The model included group-by-time interaction terms. The control group and baseline were used as reference categories. Intervention I: CGM-alone; Intervention II: CGM-guided personalized coaching. CGM-derived indices at 3 months are not reported for the control group, as CGM measurements were not conducted in this group at that time.

CV, coefficient of variation; FPG, fasting plasma glucose; GMI, glucose management indicator; Mean CGM glucose, continuous glucose monitoring-derived mean glucose (14-day average); SE, standard error; TAR180, time above range 180 (>180 mg/dL); TAR250, time above range 250 (>250 mg/dL); TBR70, time below range 70 (<70 mg/dL); TIR, time in range (70–180 mg/dL).

  • 1. World Health Organization (WHO). Diabetes [Internet]. WHO; c2024 [cited 2025 Oct 10]. Available from: https://www.who.int/news-room/fact-sheets/detail/diabetes
  • 2. International Diabetes Federation. IDF diabetes atlas [Internet]. 11th ed. International Diabetes Federation; 2025 [cited 2026 Mar 1]. Available from: https://diabetesatlas.org/resources/idf-diabetes-atlas-2025/
  • 3. American Diabetes Association Professional Practice Committee. Introduction: standards of medical care in diabetes-2022. Diabetes Care. 2022;45(Suppl 1):S1-S2. https://doi.org/10.2337/dc22-SintArticlePubMedPMC
  • 4. Tan JK, Lim GH, Mohamed Salim NN, Chia SY, Thumboo J, Bee YM. Associations between mean HbA1c, HbA1c variability, and both mortality and macrovascular complications in patients with diabetes mellitus: a registry-based cohort study. Clin Epidemiol. 2023;15:137-149. https://doi.org/10.2147/CLEP.S391749ArticlePubMedPMC
  • 5. Bin Rakhis SA, AlDuwayhis NM, Aleid N, AlBarrak AN, Aloraini AA. Glycemic control for type 2 diabetes mellitus patients: a systematic review. Cureus. 2022;14(6):e26180. https://doi.org/10.7759/cureus.26180ArticlePubMedPMC
  • 6. Azagew AW, Mekonnen CK, Lambie M, Shepherd T, Babatunde OO. Poor glycemic control and its predictors among people living with diabetes in low- and middle-income countries: a systematic review and meta-analysis. BMC Public Health. 2025;25(1):714. https://doi.org/10.1186/s12889-025-21828-yArticlePubMedPMC
  • 7. Schlesinger S, Neuenschwander M, Ballon A, Nöthlings U, Barbaresko J. Adherence to healthy lifestyles and incidence of diabetes and mortality among individuals with diabetes: a systematic review and meta-analysis of prospective studies. J Epidemiol Community Health. 2020;74(5):481-487. https://doi.org/10.1136/jech-2019-213415ArticlePubMed
  • 8. Mueller S, Dinges SM, Gass F, Fegers-Wustrow I, Treitschke J, von Korn P, et al. Telemedicine-supported lifestyle intervention for glycemic control in patients with CHD and T2DM: multicenter, randomized controlled trial. Nat Med. 2025;31:1203-1213. https://doi.org/10.1038/s41591-025-03498-wArticlePubMedPMC
  • 9. Goyal Mehra C, Raymond AM, Prabhu R. A personalized multi-interventional approach focusing on customized nutrition, progressive fitness, and lifestyle modification resulted in the reduction of HbA1c, fasting blood sugar and weight in type 2 diabetes: a retrospective study. BMC Endocr Disord. 2022;22(1):290. https://doi.org/10.1186/s12902-022-01212-2ArticlePubMedPMC
  • 10. Sarani Rad F, Hendawi R, Yang X, Li J. Personalized diabetes management with digital twins: a patient-centric knowledge graph approach. J Pers Med. 2024;14(4):359. https://doi.org/10.3390/jpm14040359ArticlePubMedPMC
  • 11. Uhl S, Choure A, Rouse B, Loblack A, Reaven P. Effectiveness of continuous glucose monitoring on metrics of glycemic control in type 2 diabetes mellitus: a systematic review and meta-analysis of randomized controlled trials. J Clin Endocrinol Metab. 2024;109(4):1119-1131. https://doi.org/10.1210/clinem/dgad652ArticlePubMed
  • 12. Yu J, Lee J, Yang Y, Lee EY, Lee SH, Cho JH. Clinical impact of personalized physician’s education and remote feedback via a digital platform on glycemic control: pilot randomized controlled trial. JMIR Mhealth Uhealth. 2025;13:e67151. https://doi.org/10.2196/67151ArticlePubMedPMC
  • 13. Zahedani AD, McLaughlin T, Veluvali A, Aghaeepour N, Hosseinian A, Agarwal S, et al. Digital health application integrating wearable data and behavioral patterns improves metabolic health. NPJ Digit Med. 2023;6(1):216. https://doi.org/10.1038/s41746-023-00956-yArticlePubMedPMC
  • 14. Zeevi D, Korem T, Zmora N, Israeli D, Rothschild D, Weinberger A, et al. Personalized nutrition by prediction of glycemic responses. Cell. 2015;163(5):1079-1094. https://doi.org/10.1016/j.cell.2015.11.001ArticlePubMedPMC
  • 15. Park Y, Choi HR, Lee JE, Choi B, Noh CB, Kang JH, et al. Impact of real-time continuous glucose monitoring and personalized digital health coaching on glycemic control and lifestyle in patients with type 2 diabetes and prediabetes. Prim Care Diabetes. 2026;20(1):61-67. https://doi.org/10.1016/j.pcd.2025.12.002ArticlePubMed
  • 16. Lu K, Mehrotra DV, Liu G. Sample size determination for constrained longitudinal data analysis. Stat Med. 2009;28(4):679-699. https://doi.org/10.1002/sim.3507ArticlePubMed
  • 17. Schulz KF, Grimes DA. Sample size calculations in randomised trials: mandatory and mystical. Lancet. 2005;365(9467):1348-1353. https://doi.org/10.1016/S0140-6736(05)61034-3ArticlePubMedPMC
  • 18. Nishimura R, Okada Y, Kuroda A, Suzuki J, Hirota Y, Matsuhisa M, et al. Consensus statement on novel glucose-related metrics obtained through advanced medical devices: English version. Diabetol Int. 2025;16:595-613. https://doi.org/10.1007/s13340-025-00820-2ArticlePubMedPMC
  • 19. ElSayed NA, Aleppo G, Aroda VR, Bannuru RR, Brown FM, Bruemmer D, et al. Glycemic targets: standards of care in diabetes-2023. Diabetes Care. 2023;46(Suppl 1):S97-S110. https://doi.org/10.2337/dc23-S006ArticlePubMedPMC
  • 20. Hopewell S, Chan AW, Collins GS, Hróbjartsson A, Moher D, Schulz KF, et al. CONSORT 2025 statement: updated guideline for reporting randomised trials. BMJ. 2025;389:e081123. https://doi.org/10.1136/bmj-2024-081123ArticlePubMedPMC
  • 21. Maiorino MI, Signoriello S, Maio A, Chiodini P, Bellastella G, Scappaticcio L, et al. Effects of continuous glucose monitoring on metrics of glycemic control in diabetes: a systematic review with meta-analysis of randomized controlled trials. Diabetes Care. 2020;43(5):1146-1156. https://doi.org/10.2337/dc19-1459ArticlePubMed
  • 22. Park C, Le QA. The effectiveness of continuous glucose monitoring in patients with type 2 diabetes: a systematic review of literature and meta-analysis. Diabetes Technol Ther. 2018;20(9):613-621. https://doi.org/10.1089/dia.2018.0177ArticlePubMed
  • 23. Ferreira RO, Trevisan T, Pasqualotto E, Chavez MP, Marques BF, Lamounier RN, et al. Continuous glucose monitoring systems in noninsulin-treated people with type 2 diabetes: a systematic review and meta-analysis of randomized controlled trials. Diabetes Technol Ther. 2024;26(4):252-262. https://doi.org/10.1089/dia.2023.0390ArticlePubMed
  • 24. Bannuru RR, Bellini NJ, Bergenstal RM, Beverly EA, Christofides EA, Cox D, et al. Continuous glucose monitoring to guide lifestyle choices with a focus on nutrition in the management of type 2 diabetes: a systematic review and meta-analysis. J Diabetes Sci Technol. 2025. https://doi.org/10.1177/19322968251384318
  • 25. Griauzde DH, Ling G, Wray D, DeJonckheere M, Mizokami Stout K, Saslow LR, et al. Continuous glucose monitoring with low-carbohydrate nutritional coaching to improve type 2 diabetes control: randomized quality improvement program. J Med Internet Res. 2022;24(2):e31184. https://doi.org/10.2196/31184ArticlePubMedPMC
  • 26. Kannenberg S, Voggel J, Thieme N, Witt O, Pethahn KL, Schütt M, et al. Unlocking potential: personalized lifestyle therapy for type 2 diabetes through a predictive algorithm-driven digital therapeutic. J Diabetes Sci Technol. 2026;20(1):113-123. https://doi.org/10.1177/19322968241266821ArticlePubMedPMC
  • 27. Reddy S, Wu CC, José A, Hsieh JL, Rautela SD. Personalized virtual care using continuous glucose monitoring in adults with type 2 diabetes treated with less intensive therapies. Clin Diabetes. 2023;41(4):452-457. https://doi.org/10.2337/cd22-0128ArticlePubMedPMC
  • 28. Raj R, Mishra R, Jha N, Joshi V, Correa R, Kern PA. Time in range, as measured by continuous glucose monitor, as a predictor of microvascular complications in type 2 diabetes: a systematic review. BMJ Open Diabetes Res Care. 2022;10(1):e002573. https://doi.org/10.1136/bmjdrc-2021-002573ArticlePubMedPMC
  • 29. Lu J, Wang C, Shen Y, Chen L, Zhang L, Cai J, et al. Time in range in relation to all-cause and cardiovascular mortality in patients with type 2 diabetes: a prospective cohort study. Diabetes Care. 2021;44(2):549-555. https://doi.org/10.2337/dc20-1862ArticlePubMedPMC
  • 30. Willis HJ, Asche SE, McKenzie AL, Adams RN, Roberts CG, Volk BM, et al. Impact of continuous glucose monitoring versus blood glucose monitoring to support a carbohydrate-restricted nutrition intervention in people with type 2 diabetes. Diabetes Technol Ther. 2025;27(5):341-356. https://doi.org/10.1089/dia.2024.0406ArticlePubMed
  • 31. Bohlen LC, Crawshaw J, Jospe MR, Richardson KM, Konnyu KJ, Schembre SM. Identifying behaviour change techniques within precision health interventions that use continuous glucose monitoring: a secondary analysis of a scoping review. Int J Behav Nutr Phys Act. 2025;22(1):139. https://doi.org/10.1186/s12966-025-01833-5ArticlePubMedPMC
  • 32. Veluvali A, Dehghani Zahedani A, Hosseinian A, Aghaeepour N, McLaughlin T, Woodward M, et al. Impact of digital health interventions on glycemic control and weight management. NPJ Digit Med. 2025;8(1):20. https://doi.org/10.1038/s41746-025-01430-7ArticlePubMedPMC
  • 33. Ji C, Jiang T, Liu L, Zhang J, You L. Continuous glucose monitoring combined with artificial intelligence: redefining the pathway for prediabetes management. Front Endocrinol (Lausanne). 2025;16:1571362. https://doi.org/10.3389/fendo.2025.1571362ArticlePubMedPMC
  • 34. Shamanna P, Joshi SR, Thajudeen M, Shah L, Poon T, Mohamed M, et al. Personalized nutrition in type 2 diabetes remission: application of digital twin technology for predictive glycemic control. Front Endocrinol (Lausanne). 2024;15:1485464. https://doi.org/10.3389/fendo.2024.1485464ArticlePubMedPMC
  • 35. Elgammal Z, Albrijawi MT, Alhajj R. Digital twins in healthcare: a review of AI-powered practical applications across health domains. J Big Data. 2025;12(1):234. https://doi.org/10.1186/s40537-025-01280-wArticle
  • 36. Shamanna P, Erukulapati RS, Shukla A, Shah L, Willis B, Thajudeen M, et al. One-year outcomes of a digital twin intervention for type 2 diabetes: a retrospective real-world study. Sci Rep. 2024;14(1):25478. https://doi.org/10.1038/s41598-024-76584-7ArticlePubMedPMC

Figure & Data

REFERENCES

    Citations

    Citations to this article as recorded by  

      • ePub LinkePub Link
      • Cite
        CITE
        export Copy Download
        Close
        Download Citation
        Download a citation file in RIS format that can be imported by all major citation management software, including EndNote, ProCite, RefWorks, and Reference Manager.

        Format:
        • RIS — For EndNote, ProCite, RefWorks, and most other reference management software
        • BibTeX — For JabRef, BibDesk, and other BibTeX-specific software
        Include:
        • Citation for the content below
        Effect of a continuous glucose monitoring-guided personalized lifestyle coaching intervention on glycemic outcomes and variability in patients with type 2 diabetes mellitus: a randomized controlled trial
        Close
      • XML DownloadXML Download
      Figure
      • 0
      • 1
      We recommend
      Related articles
      Effect of a continuous glucose monitoring-guided personalized lifestyle coaching intervention on glycemic outcomes and variability in patients with type 2 diabetes mellitus: a randomized controlled trial
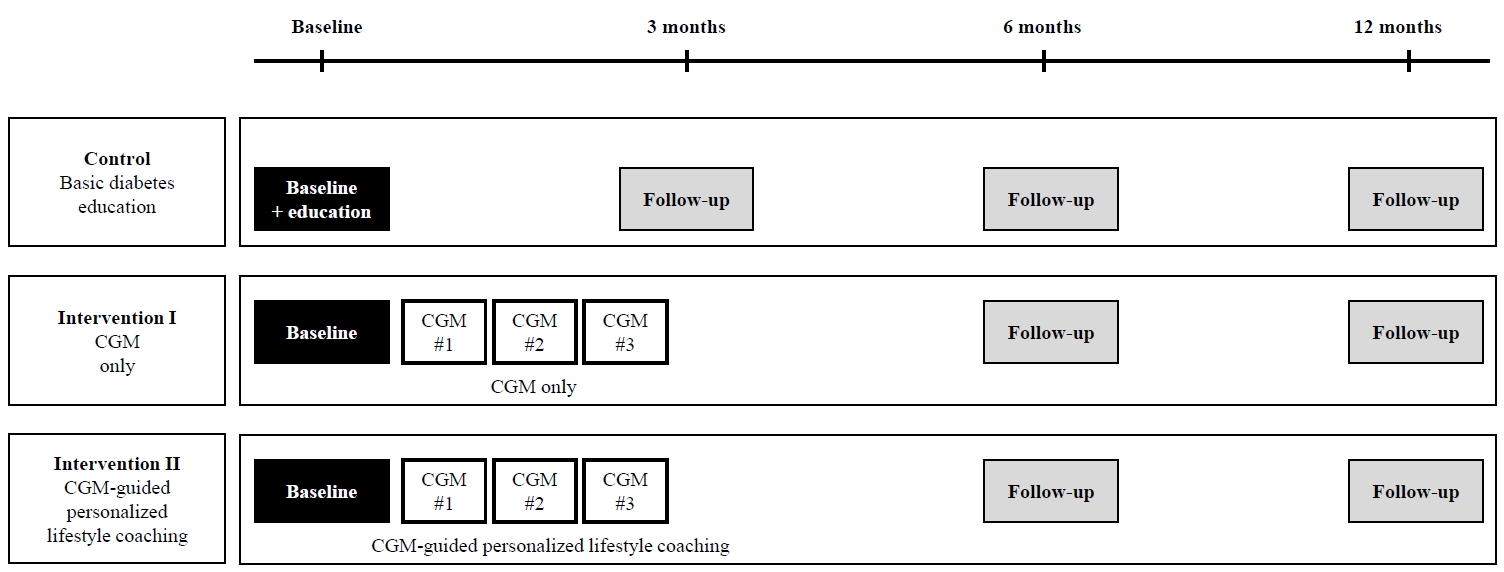
      Image Image
      Fig. 1. Flowchart of participant selection. CGM, continuous glucose monitoring; V, visit. Note. The number of observations included in the GEE analyses varied by outcome and time point.
      Fig. 2. Intervention flow and data collection schedule across the three study groups at baseline, 3 months, 6 months, and 12 months. Participants were assigned to one of three groups: the Control group received basic diabetes education at baseline only; Intervention I received continuous glucose monitoring (CGM) administered 3 consecutive times during the first 3 months; and Intervention II received the CGM-guided personalized lifestyle coaching delivered concurrently with the CGM sessions. All three groups completed identical follow-up assessments at 3, 6, and 12 months.
      Effect of a continuous glucose monitoring-guided personalized lifestyle coaching intervention on glycemic outcomes and variability in patients with type 2 diabetes mellitus: a randomized controlled trial
      Characteristic Total Control Intervention I Intervention II χ2/F (p)
      Sex 2.13 (.346)
       Male 54 (52.9) 15 (44.1) 18 (52.9) 21 (61.8)
       Female 48 (47.1) 19 (55.9) 16 (47.1) 13 (38.2)
      Age (yr) 58.3±10.6 56.4±11.4 58.5±9.0 59.9±11.1 0.96 (.387)
      Education level 4.10 (.128)
       High school or less 47 (46.1) 11 (32.4) 19 (55.9) 17 (50.0)
       College or more 55 (53.9) 23 (67.6) 15 (44.1) 17 (50.0)
      Living situation 0.87 (.647)
       With family 82 (80.4) 29 (85.3) 27 (79.4) 26 (76.5)
       Alone 20 (19.6) 5 (14.7) 7 (20.6) 8 (23.5)
      Employment 2.41 (.300)
       Yes 73 (71.6) 26 (76.5) 26 (76.5) 21 (61.8)
       No 29 (28.4) 8 (23.5) 8 (23.5) 13 (38.2)
      Working type (among employed participants, n=73) 0.07 (.967)
       Regular work 67 (91.8) 24 (92.3) 24 (92.3) 19 (90.5)
       Shift work 6 (8.2) 2 (7.7) 2 (7.7) 2 (9.5)
      Household income (1,000 KRW) 1.44 (.838)
       <2,000 22 (21.6) 7 (20.6) 9 (26.5) 6 (17.6)
       2,000–<4,000 34 (33.3) 10 (29.4) 12 (35.3) 12 (35.3)
       ≥4,000 46 (45.1) 17 (50.0) 13 (38.2) 16 (47.1)
      Health insurance 3.19 (.203)
       National health insurance 96 (94.1) 33 (97.1) 30 (88.2) 33 (97.1)
       Medical aid 6 (5.9) 1 (2.9) 4 (11.8) 1 (2.9)
      Diabetes duration (yr) 14.6±10.4 14.0±10.2 13.1±9.9 16.7±11.1 1.13 (.327)
      Experience of hospital admission due to diabetes 3.97 (.138)
       Ever 12 (11.8) 5 (14.7) 6 (17.6) 1 (2.9)
       Never 90 (88.2) 29 (85.3) 28 (82.4) 33 (97.1)
      Experience of receiving diabetes education in the past 6 months 0.00 (>.999)
       Ever 3 (3.0) 1 (2.9) 1 (3.0) 1 (3.0)
       Never 97 (97.0) 33 (97.1) 32 (97.0) 32 (97.0)
      Diabetes complications/comorbidities 0.09 (.957)
       Present 35 (34.3) 11 (32.4) 12 (35.3) 12 (35.3)
       Absent 67 (65.7) 23 (67.6) 22 (64.7) 22 (64.7)
      Ever heard of CGM 0.25 (.883)
       Ever 39 (38.2) 14 (41.2) 12 (35.3) 13 (38.2)
       Never 63 (61.8) 20 (58.8) 22 (64.7) 21 (61.8)
      Glucose-lowering treatment 5.68 (.225)
       Insulin only 1 (1.0) 1 (2.9) 0 (0.0) 0 (0.0)
       Oral hypoglycemic agent plus insulin 18 (17.6) 6 (17.7) 9 (26.5) 3 (8.8)
       Oral hypoglycemic agent only 83 (81.4) 27 (79.4) 25 (73.5) 31 (91.2)
      Frequency of SMBG 0.10 (.999)
       None 59 (57.8) 20 (58.8) 20 (58.8) 19 (55.9)
       Once a day 31 (30.4) 10 (29.4) 10 (29.4) 11 (32.3)
       Twice or more a day 12 (11.8) 4 (11.8) 4 (11.8) 4 (11.8)
      Diabetes management (multiple responses)
       None 20 (19.6) 8 (23.5) 5 (14.7) 7 (20.6) 0.87 (.647)
       Diet 40 (39.2) 12 (35.3) 16 (47.1) 12 (35.3) 1.32 (.518)
       Exercise 71 (69.6) 23 (67.6) 26 (76.5) 22 (64.7) 1.21 (.547)
       Health functional foods 21 (20.6) 7 (20.6) 8 (23.5) 6 (17.6) 0.36 (.835)
       Folk remedies 14 (13.7) 3 (8.8) 7 (20.6) 4 (11.8) 2.15 (.341)
      Experience of hypoglycemia 0.15 (.929)
       Ever 16 (15.7) 5 (14.7) 5 (14.7) 6 (17.6)
       Never 86 (84.3) 29 (85.3) 29 (85.3) 28 (82.4)
      FPG 149.2±47.4 151.7±45.2 159.1±54.6 136.6±39.5 1.99 (.141)
      HbA1c 8.2±1.3 8.4±1.1 8.1±1.3 8.1±1.4 0.58 (.563)
      Time CGM active (%) 91.8±7.6 91.1±7.6 92.6±6.6 91.7±8.7 0.34 (.712)
      Mean CGM-derived glucose levels (mg/dL) 177.8±38.6 187.5±35 178.1±44.2 168.1±34.9 2.16 (.120)
      GMI (%) 7.6±0.9 7.8±0.8 7.6±1.1 7.3±0.8 2.18 (.118)
      TIR 70–180 mg/dL (%) 60.4±21.8 54.1±20.9 61.7±22.6 65.4±20.9 2.44 (.093)
      TBR <54 mg/dL (%) 0.04±0.20 0.03±0.17 0.03±0.18 0.06±0.24 0.22 (.802)
      TBR <70 mg/dL (%) 0.5±1.5 0.5±1.5 0.4±1.1 0.6±1.9 0.16 (.852)
      TAR >180 mg/dL (%) 24.7±10.7 28.3±10.7 23.3±10.4 22.7±10.4 2.84 (.063)
      TAR >250 mg/dL (%) 14.3±15.7 17.1±14.5 14.6±19 11.2±13.3 1.19 (.310)
      CV (%) 30.7±7.2 30.5±8.1 30.6±7.1 30.9±6.6 0.03 (.968)
      CGM-detected hypoglycemic events 3.1±20.5 7.5±35.6 0.8±2.1 1.3±2.9 1.03 (.362)
      Indicator Time Control Intervention I Intervention II Control vs. intervention I Control vs. intervention II Intervention I vs. intervention II
      Mean±SE Mean±SE Mean±SE Adj. MD±SE p Adj. MD±SE p Adj. MD±SE p
      HbA1c (%) Baseline 8.39±0.10 8.14±0.11 8.06±0.12 - - - - - -
      3 mo 8.12±0.24 7.35±0.17 7.01±0.14 0.78±0.29 .008 1.12±0.27 <0.001 0.34±0.22 .127
      6 mo 8.01±0.22 7.76±0.23 7.21±0.18 0.25±0.32 .432 0.80±0.29 .005 0.55±0.30 .064
      12 mo 7.86±0.20 7.76±0.20 7.70±0.34 0.11±0.28 .699 0.16±0.39 .683 0.05±0.39 .892
      FPG (mg/dL) Baseline 151.74±3.83 159.06±4.63 136.58±3.40 - - - - - -
      3 mo 162.53±7.96 128.48±6.01 127.76±5.31 34.05±9.97 .001 34.77±9.57 <0.001 −0.73±8.02 .928
      6 mo 149.47±5.55 153.62±8.50 133.79±9.58 −4.15±10.15 .682 15.67±11.07 .157 19.83±12.80 .121
      12 mo 146.39±6.19 155.07±6.83 151.16±8.46 −8.68±9.22 .347 −4.77±10.48 .649 3.91±10.87 .719
      Mean CGM glucose (mg/dL) Baseline 187.55±3.01 178.13±3.86 168.15±2.96 - - - - - -
      3 mo - 163.63±5.38 147.69±4.32 - - - - 15.94±6.90 .021
      6 mo 179.57±7.58 173.11±6.37 149.21±5.88 6.46±9.90 .514 30.36±9.60 .002 23.89±8.67 .006
      12 mo 174.48±6.18 169.37±7.23 162.62±9.03 5.11±9.51 .591 11.87±10.94 .278 6.75±11.56 .559
      GMI (%) Baseline 7.80±0.07 7.57±0.09 7.33±0.07 - - - - - -
      3 mo - 7.22±0.13 6.84±0.10 - - - - 0.38±0.16 .022
      6 mo 7.60±0.18 7.45±0.15 6.88±0.14 0.15±0.24 .520 0.73±0.23 .002 0.57±0.21 .006
      12 mo 7.48±0.15 7.37±0.17 7.19±0.22 0.11±0.23 .611 0.29±0.27 .272 0.18±0.28 .528
      TIR (%) Baseline 54.06±1.80 61.72±1.98 65.44±1.77 - - - - - -
      3 mo - 68.30±3.50 79.21±3.13 - - - - −10.91±4.69 .020
      6 mo 59.61±4.00 62.25±4.06 76.32±3.65 −2.64±5.70 .643 −16.71±5.41 .002 −14.07±5.45 .010
      12 mo 59.93±3.68 64.78±4.12 73.08±4.18 −4.85±5.52 .380 −13.15±5.57 .018 −8.30±5.87 .157
      TBR70 (%) Baseline 0.52±0.13 0.38±0.10 0.59±0.16 - - - - - -
      3 mo - 2.00±0.69 2.17±0.68 - - - - −0.17±0.97 .864
      6 mo 3.00±0.62 1.71±0.33 3.89±0.78 1.29±0.71 .069 −0.89±1.00 .372 −2.18±0.85 .010
      12 mo 5.00±1.60 2.50±0.68 1.38±0.17 2.50±1.74 .152 3.63±1.61 .025 1.13±0.71 .111
      TAR180 (%) Baseline 28.27±0.92) 23.25±0.90 22.71±0.88 - - - - - -
      3 mo - 21.27±2.26 15.79±2.04 - - - - 5.47±3.04 .072
      6 mo 25.11±1.77 25.54±2.07 17.26±2.05 −0.43±2.72 .875 7.85±2.71 .004 8.28±2.91 .004
      12 mo 25.70±1.93 23.22±2.00 19.24±2.22 2.48±2.78 .372 6.46±2.94 .028 3.98±2.99 .183
      TAR250 (%) Baseline 17.12±1.25 14.36±1.66 11.24±1.13 - - - - - -
      3 mo - 10.82±2.10 8.19±1.64 - - - - 2.63±2.66) .323
      6 mo 16.40±3.34 12.69±2.60 9.41±2.82 3.71±4.24 .381 6.99±4.37 .110 3.28±3.83) .392
      12 mo 14.58±2.35 13.22±3.35 13.19±3.95 1.37±4.09 .739 1.39±4.60 .762 0.03±5.18) .996
      CV (%) Baseline 30.46±0.69 30.58±0.62 30.90±0.56 - - - - - -
      3 mo - 30.38±1.25 27.57±1.25 - - - - 2.81±1.76) .111
      6 mo 30.98±1.30 30.30±1.09 29.28±1.37 0.68±1.69 .687 1.70±1.89 .368 1.02±1.75) .561
      12 mo 31.52±1.55 30.23±1.23 28.81±1.43 1.29±1.97 .514 2.72±2.10 .197 1.43±1.88) .449
      CGM-detected hypoglycemic events Baseline 7.45±6.30 0.81±0.36 1.28±0.51 - - - - - -
      3 mo - 0.73±0.30 1.67±0.62 - - - - –0.93±0.69 .177
      6 mo 1.11±0.45 1.43±0.57 2.27±0.64 –0.31±0.73 .668 –1.15±0.79 .142 –0.84±0.86 .330
      12 mo 2.40±1.06 1.85±0.64 1.04±0.29 0.55±1.23 .657 1.36±1.09 .215 0.81±0.70 .280
      Outcome Time point (mo) B SE p Wald χ2 p
      HbA1c (%) 13.53 .035
       Intervention I 3 –0.07 0.04 .052
      6 0.00 0.04 .945
      12 0.02 0.03 .599
       Intervention II 3 –0.11 0.04 .003
      6 –0.07 0.04 .076
      12 0.02 0.04 .633
      FPG (mg/dL) 28.64 <.001
       Intervention I 3 –0.28 0.09 .003
      6 –0.02 0.10 .841
      12 0.01 0.07 .884
      Intervention II 3 –0.14 0.07 .069
      6 –0.01 0.08 .944
      12 0.14 0.07 .049
      Mean CGM glucose (mg/dL) 11.55 .041
       Intervention I 3 0.045 0.042 .285
      6 0.015 0.043 .731
      12 0.022 0.045 .628
       Intervention II 6 –0.076 0.046 .095
      12 0.039 0.054 .473
      GMI (%) 10.21 .069
       Intervention I 3 0.02 0.02 .341
      6 0.01 0.02 .705
      12 0.01 0.03 .571
      Intervention II 6 -0.04 0.03 .121
      12 0.02 0.03 .478
      TIR (%) 7.26 .202
       Intervention I 3 –0.09 0.06 .113
      6 –0.09 0.07 .231
      12 –0.06 0.08 .481
       Intervention II 6 0.06 0.07 .435
      12 0.01 0.08 .929
      TBR70 (%) 30.54 <.001
       Intervention I 3 0.25 0.55 .649
      6 –0.21 0.50 .672
      12 –0.34 0.49 .484
       Intervention II 6 0.28 0.53 .596
      12 –1.27 0.53 .017
      TAR180 (%) 9.94 .081
       Intervention I 3 0.27 0.12 .019
      6 0.21 0.10 .039
      12 0.09 0.11 .379
       Intervention II 6 –0.16 0.12 .191
      12 –0.07 0.13 .588
      TAR250 (%) 2.39 .792
       Intervention I 3 0.01 0.32 .977
      6 –0.13 0.23 .557
      12 0.02 0.26 .928
       Intervention II 6 –0.16 0.32 .604
      12 0.29 0.31 .342
      CV (%) 9.05 .113
       Intervention I 3 0.11 0.05 .018
      6 –0.03 0.04 .514
      12 –0.05 0.04 .219
       Intervention II 6 –0.07 0.05 .170
      12 –0.10 0.05 .037
      CGM-detected hypoglycemic events 21.49 <.001
       Intervention I 3 –0.37 0.54 .496
      6 2.46 1.01 .014
      12 1.96 1.01 .052
       Intervention II 6 2.47 1.01 .015
      12 0.93 1.09 .396
      Table 1. Baseline characteristics of randomized participants

      Values are presented as number (%) or mean±standard deviation. Percentages may not total 100.0 because of rounding to one decimal place. Percentages for diabetes management variables were calculated separately for each item because multiple responses were allowed. For receipt of diabetes education within the previous 6 months, data were missing for two participants; percentages were calculated from available cases (n=100). For diabetes management, multiple responses were allowed; percentages were calculated separately for each item using N=102 for the total sample and n=34 for each study group and therefore do not sum to 100.0%.

      CGM, continuous glucose monitoring; CV, coefficient of variation; FPG, fasting plasma glucose; GMI, glucose management indicator; HbA1c, glycated hemoglobin; KRW, Korean won; SMBG, self-monitoring of blood glucose; TAR, time above range; TBR, time below range; TIR, time in range.

      Table 2. Changes in glycemic outcomes and variability by group and time (by GEE)

      Baseline values are unadjusted descriptive statistics; adjusted means at 3, 6, and 12 months were derived from generalized estimating equation models controlling for time, group, and group-by-time interaction effects. The control group and baseline were used as reference categories. The GEE model adjusted for repeated measures with robust SEs. Intervention Group I: CGM-alone; Intervention Group II: CGM-guided personalized coaching.

      Adj. MD, adjusted mean difference; CV, coefficient of variation; FPG, fasting plasma glucose; GEE, generalized estimating equation; GMI, glucose management indicator; Mean CGM glucose, continuous glucose monitoring-derived mean glucose (14-day average); SE, standard error; TAR180, time above range 180 (>180 mg/dL); TAR250, time above range 250 (>250 mg/dL); TBR70, time below range 70 (<70 mg/dL); TIR, time in range (70–180 mg/dL).

      Table 3. Interaction effects of time and group on glycemic outcomes and variability

      Regression coefficients represent changes from baseline within each group. The model included group-by-time interaction terms. The control group and baseline were used as reference categories. Intervention I: CGM-alone; Intervention II: CGM-guided personalized coaching. CGM-derived indices at 3 months are not reported for the control group, as CGM measurements were not conducted in this group at that time.

      CV, coefficient of variation; FPG, fasting plasma glucose; GMI, glucose management indicator; Mean CGM glucose, continuous glucose monitoring-derived mean glucose (14-day average); SE, standard error; TAR180, time above range 180 (>180 mg/dL); TAR250, time above range 250 (>250 mg/dL); TBR70, time below range 70 (<70 mg/dL); TIR, time in range (70–180 mg/dL).


      J Korean Acad Nurs : Journal of Korean Academy of Nursing
      Close layer
      TOP