 Submit an article
Articles
- Page Path
- HOME > J Korean Acad Nurs > Volume 55(4); 2025 > Article
-
Research Paper
- Multidimensional factors influencing the completion of advance directives among community-dwelling older Koreans
-
Hee-Ju Ji
 , Soong-Nang Jang
 -
Journal of Korean Academy of Nursing 2025;55(4):543-556.
DOI: https://doi.org/10.4040/jkan.25098
Published online: November 18, 2025
Red Cross College of Nursing, Chung-Ang University, Seoul, Korea
- Corresponding author: Soong-Nang Jang Red Cross College of Nursing, Chung-Ang University, 84 Heukseok-ro, Dongjak-gu, Seoul 06974, Korea E-mail: sjang@cau.ac.kr
• Received: July 14, 2025 • Revised: October 10, 2025 • Accepted: October 10, 2025
© 2025 Korean Society of Nursing Science
This is an Open Access article distributed under the terms of the Creative Commons Attribution NoDerivs License (http://creativecommons.org/licenses/by-nd/4.0) If the original work is properly cited and retained without any modification or reproduction, it can be used and re-distributed in any format and medium.
- 2,321 Views
- 218 Download
Abstract
-
Purpose
- This study aimed to examine the multidimensional factors associated with the completion of advance directives (ADs) among community-dwelling older Koreans, guided by conceptual frameworks developed in Asian contexts.
-
Methods
- Data from the 2023 National Survey of Older Koreans (sixth wave) were analyzed for 9,951 community-dwelling older Koreans aged 65 years or older. Complex sample cross-tabulation and binary logistic regression analyses were conducted.
-
Results
- In total, 11.1% of community-dwelling older Koreans had completed an AD. Significant factors associated with AD completion were identified across four domains—personal situation: age, educational level, religion, and housing preference in the event of poor health; socio-cultural: presence of children, participation in social activities and satisfaction with social relationships; physical and illness: the number of chronic diseases; and value system: awareness of hospice and palliative services, participation in death preparedness education, and documentation of organ donation.
-
Conclusion
- Among older Koreans, AD completion represents more than a documentation process; it reflects a complex decision-making process shaped by their values and life circumstances, underscoring the need for supportive interventions. As the highest AD completion rates are found among older adults, related policies should be aligned with older adult-centered policy frameworks.
Introduction
Methods
1) Dependent variable
2) Independent variables
(1) Personal situation factors
(2) Socio-cultural factors
(3) Physical and illness factors
(4) Value system
Results
Discussion
Conclusion
-
Conflicts of Interest
No potential conflict of interest relevant to this article was reported.
-
Acknowledgements
None.
-
Funding
None.
-
Data Sharing Statement
The raw data in this study can be accessed through the Statistics Korea Micro Data Integrated Service website (https://mdis.kostat.go.kr/index.do) after agreeing to the ‘User Agreement for Raw Data Access.’ The dataset analyzed in this study was derived from the original raw data. The processed dataset is not publicly available; however, it can be requested.
-
Author Contributions
Conceptualization and/or Methodology: SNJ, HJJ. Data curation and/or Analysis: HJJ. Project administration and/or Supervision: SNJ. Resources and/or Software: HJJ. Validation: SNJ. Writing original draft or/and Review & Editing: SNJ, HJJ. Final approval of the manuscript: all authors.
Article Information

Table 1.Comparison of characteristics by advance directive completion status (N=9,951)
Table 2.Factors associated with advance directive completion (N=9,951)
- 1. McLeod-Sordjan R. Death preparedness: development and initial validation of the advance planning preparedness scale. Omega (Westport). 2023 Nov 3 [Epub]. https://doi.org/10.1177/00302228231212998ArticlePubMed
- 2. Morrison RS, Meier DE, Arnold RM. What’s wrong with advance care planning? JAMA. 2021;326(16):1575-1576. https://doi.org/10.1001/jama.2021.16430ArticlePubMedPMC
- 3. Sudore RL, Lum HD, You JJ, Hanson LC, Meier DE, Pantilat SZ, et al. Defining advance care planning for adults: a consensus definition from a multidisciplinary Delphi panel. J Pain Symptom Manage. 2017;53(5):821-832. https://doi.org/10.1016/j.jpainsymman.2016.12.331ArticlePubMedPMC
- 4. Choi S, Ko H. Factors affecting advance directives completion among older adults in Korea. Front Public Health. 2024;12:1329916. https://doi.org/10.3389/fpubh.2024.1329916ArticlePubMedPMC
- 5. Sedini C, Biotto M, Crespi Bel'skij LM, Moroni Grandini RE, Cesari M. Advance care planning and advance directives: an overview of the main critical issues. Aging Clin Exp Res. 2022;34(2):325-330. https://doi.org/10.1007/s40520-021-02001-yArticlePubMedPMC
- 6. Kernick LA, Hogg KJ, Millerick Y, Murtagh FE, Djahit A, Johnson M. Does advance care planning in addition to usual care reduce hospitalisation for patients with advanced heart failure: a systematic review and narrative synthesis. Palliat Med. 2018;32(10):1539-1551. https://doi.org/10.1177/0269216318801162ArticlePubMed
- 7. Schichtel M, Wee B, Perera R, Onakpoya I. The effect of advance care planning on heart failure: a systematic review and meta-analysis. J Gen Intern Med. 2020;35(3):874-884. https://doi.org/10.1007/s11606-019-05482-wArticlePubMedPMC
- 8. Kim J, Kim S, Hong SW, Kang SW, An M. Validation of the decisional conflict scale for evaluating advance care decision conflict in community-dwelling older adults. Asian Nurs Res (Korean Soc Nurs Sci). 2017;11(4):297-303. https://doi.org/10.1016/j.anr.2017.11.004ArticlePubMed
- 9. Park EJ, Jo M, Park M, Kang SJ. Advance care planning for older adults in community-based settings: an umbrella review. Int J Older People Nurs. 2021;16(5):e12397. https://doi.org/10.1111/opn.12397ArticlePubMed
- 10. National Agency for Management of Life-sustaining Treatment. Monthly statistics [Internet]. National Agency for Management of Life-sustaining Treatment; 2025 [cited 2025 Apr 27] Available from: https://www.lst.go.kr/comm/monthlyStatistics.do
- 11. Sánchez-García S, García-Peña C, Ramírez-García E, Moreno-Tamayo K, Cantú-Quintanilla GR. Decreased autonomy in community-dwelling older adults. Clin Interv Aging. 2019;14:2041-2053. https://doi.org/10.2147/CIA.S225479ArticlePubMedPMC
- 12. Abma T, Bendien E. Autonomy in old age. Fam Law. 2019;5:102. https://doi.org/10.5553/FenR/.000040Article
- 13. Institute of Medicine. Dying in America: improving quality and honoring individual preferences near the end of life. National Academies Press; 2015. https://doi.org/10.17226/18748Article
- 14. Gao F, Chui PL, Che CC, Xiao L, Zhang Q. Advance care planning readiness among community-dwelling older adults and the influencing factors: a scoping review. BMC Palliat Care. 2024;23(1):255. https://doi.org/10.1186/s12904-024-01583-4ArticlePubMedPMC
- 15. National Agency for Management of Life-Sustaining Treatment. 2023 Annual report on the life-sustaining treatment decisions system. National Agency for Management of Life-Sustaining Treatment; 2024. Report No.: 11-B553958-000001-10.
- 16. Golmohammadi M, Ebadi A, Ashrafizadeh H, Rassouli M, Barasteh S. Factors related to advance directives completion among cancer patients: a systematic review. BMC Palliat Care. 2024;23(1):3. https://doi.org/10.1186/s12904-023-01327-wArticlePubMedPMC
- 17. Xu X, Chau PH, Cheung DST, Ho MH, Lin CC. Preferences for end-of-life care: a cross-sectional survey of Chinese frail nursing home residents. J Clin Nurs. 2023;32(7-8):1455-1465. https://doi.org/10.1111/jocn.16483ArticlePubMed
- 18. Tang JM, Cher BX, Lim SF, Siah CJ. A meta-synthesis on the older adults’ perspective of advance care planning. J Clin Nurs. 2023;32(13-14):4176-4194. https://doi.org/10.1111/jocn.16629ArticlePubMed
- 19. Ho LY, Kwong EW, Song MS, Kawakami A, Boo S, Lai CK, et al. Decision-making preferences on end-of-life care for older people: exploration and comparison of Japan, the Hong Kong SAR and South Korea in East Asia. J Clin Nurs. 2022;31(23-24):3498-3509. https://doi.org/10.1111/jocn.16178ArticlePubMed
- 20. Zhu T, Zhang J, Shi Y, Yi J, Zhang Q, Zhao Y, et al. Awareness and attitudes toward advance care planning among community-dwelling older adults in China: a mixed-methods study. Am J Hosp Palliat Care. 2020;37(9):743-749. https://doi.org/10.1177/1049909120905255ArticlePubMed
- 21. Andreasen P, Forma L, Pietilä I. Factors associated with living will among older persons receiving long-term care in Finland. Palliat Care Soc Pract. 2023;17:26323524231212513. https://doi.org/10.1177/26323524231212513ArticlePubMedPMC
- 22. Wang K, Liu Y, Sun F, Kong D, Jiang L, Wu B. Advance directive completion and its associated factors among older Chinese Americans. J Am Med Dir Assoc. 2021;22(2):344-348. https://doi.org/10.1016/j.jamda.2020.06.049ArticlePubMed
- 23. Deng RL, Duan JZ, Zhang JH, Miao JR, Chen LL, Lee DT. Advance care planning for frail older people in China: a discussion paper. Nurs Ethics. 2018;26(6):1696-1706. https://doi.org/10.1177/0969733018779177ArticlePubMed
- 24. Chan HY, Pang SM. Readiness of Chinese frail old age home residents towards end-of-life care decision making. J Clin Nurs. 2011;20(9-10):1454-1461. https://doi.org/10.1111/j.1365-2702.2010.03670.xArticlePubMed
- 25. Chan CW, Choi KC, Chan HY, Wong MM, Ling GC, Chow KM, et al. Unfolding and displaying the influencing factors of advance directives from the stakeholder’s perspective: a concept mapping approach. J Adv Nurs. 2019;75(7):1549-1562. https://doi.org/10.1111/jan.14017ArticlePubMed
- 26. Ministry of Health and Welfare. 2023 National survey of older Koreans [Internet]. Ministry of Health and Welfare; 2023 [cited 2025 Apr 4] Available from: https://www.mohw.go.kr/board.es?mid=a10411010200&bid=0019&act=view&list_no=1483359&tag=&nPage=1
- 27. Successful Aging 2. 0: conceptual expansions for the 21st century. J Gerontol B Psychol Sci Soc Sci. 2015;70(4):593-596. https://doi.org/10.1093/geronb/gbv025ArticlePubMed
- 28. Ho M, Pullenayegum E, Fuller-Thomson E. Is social participation associated with successful aging among older Canadians?: findings from the Canadian Longitudinal Study on Aging (CLSA). Int J Environ Res Public Health. 2023;20(12):6058. https://doi.org/10.3390/ijerph20126058ArticlePubMedPMC
- 29. Peduzzi P, Concato J, Kemper E, Holford TR, Feinstein AR. A simulation study of the number of events per variable in logistic regression analysis. J Clin Epidemiol. 1996;49(12):1373-1379. https://doi.org/10.1016/s0895-4356(96)00236-3ArticlePubMed
- 30. Chang HY, Takemura N, Chau PH, Lin CC. Prevalence and predictors of advance directive among terminally ill patients in Taiwan before enactment of Patient Right to Autonomy Act: a nationwide population-based study. BMC Palliat Care. 2022;21(1):178. https://doi.org/10.1186/s12904-022-01069-1ArticlePubMedPMC
- 31. de Heer G, Saugel B, Sensen B, Rübsteck C, Pinnschmidt HO, Kluge S. Advance directives and powers of attorney in intensive care patients. Dtsch Arztebl Int. 2017;114(21):363-370. https://doi.org/10.3238/arztebl.2017.0363ArticlePubMedPMC
- 32. Agredano RS, Fraile VM, Estrada-Masllorens JM, Guix-Comellas EM, Masclans JG, Poyato ML. Comprehensive geriatric assessment of the nonagenarian population. Procedia Soc Behav Sci. 2017;237:1371-1375. https://doi.org/10.1016/j.sbspro.2017.02.197Article
- 33. Koss CS. Beyond the individual: the interdependence of advance directive completion by older married adults. J Am Geriatr Soc. 2017;65(7):1615-1620. https://doi.org/10.1111/jgs.14939ArticlePubMed
- 34. Lee JE, Shin DW, Son KY, Park HJ, Lim JY, Song MS, et al. Factors influencing attitudes toward advance directives in Korean older adults. Arch Gerontol Geriatr. 2018;74:155-161. https://doi.org/10.1016/j.archger.2017.10.008ArticlePubMed
- 35. Sudore RL, Boscardin J, Feuz MA, McMahan RD, Katen MT, Barnes DE. Effect of the PREPARE website vs an easy-to-read advance directive on advance care planning documentation and engagement among veterans: a randomized clinical trial. JAMA Intern Med. 2017;177(8):1102-1109. https://doi.org/10.1001/jamainternmed.2017.1607ArticlePubMedPMC
- 36. Rao JK, Anderson LA, Lin FC, Laux JP. Completion of advance directives among U.S. consumers. Am J Prev Med. 2014;46(1):65-70. https://doi.org/10.1016/j.amepre.2013.09.008ArticlePubMedPMC
- 37. House SA, Schoo C, Ogilvie WA. Advance directives [Internet]. StatPearls Publishing; 2025 [cited 2025 Aug 28]. Available from: https://www.ncbi.nlm.nih.gov/books/NBK459133/PubMed
- 38. Lei L, Gerlach LB, Powell VD, Maust DT. Caregiver support and place of death among older adults. J Am Geriatr Soc. 2021;69(5):1221-1230. https://doi.org/10.1111/jgs.17055ArticlePubMedPMC
- 39. Peterson LJ, Dobbs D, Meng H, Gamaldo A, O'Neil K, Hyer K. Sharing end-of-life care preferences with family members: who has the discussion and who does not. J Palliat Med. 2018;21(4):463-472. https://doi.org/10.1089/jpm.2017.0357ArticlePubMed
- 40. Iunius LA, Vilpert S, Meier C, Jox RJ, Borasio GD, Maurer J. Advance care planning: a story of trust within the family. J Appl Gerontol. 2023;43(4):349-362. https://doi.org/10.1177/07334648231214905ArticlePubMedPMC
- 41. Kim J, Shin MS, Jang AY, Kim S, Heo S, Cha E, et al. Advance directives and factors associated with the completion in patients with heart failure. Int J Environ Res Public Health. 2021;18(4):1780. https://doi.org/10.3390/ijerph18041780ArticlePubMedPMC
- 42. Wu YL, Yang CY, Lin TW, Shen PH, Tsai ZD, Liu CN, et al. Factors impacting advance decision making and health care agent appointment among Taiwanese urban residents after the passage of Patient Right to Autonomy Act. Healthcare (Basel). 2023;11(10):1478. https://doi.org/10.3390/healthcare11101478ArticlePubMedPMC
- 43. Park S, Ko Y. The sociocultural meaning of “my place”: rural Korean elderly people’s perspective of aging in place. Asian Nurs Res (Korean Soc Nurs Sci). 2020;14(2):97-104. https://doi.org/10.1016/j.anr.2020.04.001ArticlePubMed
- 44. Cohen MG, Althouse AD, Arnold RM, Bulls HW, White D, Chu E, et al. Is advance care planning associated with decreased hope in advanced cancer? JCO Oncol Pract. 2021;17(2):e248-e256. https://doi.org/10.1200/OP.20.00039ArticlePubMedPMC
- 45. Baughman KR, Ludwick R, Audi A, Harlan L. Gender and couple status differences in advance care planning: a cross-sectional study. Palliat Care Soc Pract. 2024;18:26323524241287221. https://doi.org/10.1177/26323524241287221ArticlePubMedPMC
- 46. Nagelschmidt K, Leppin N, Seifart C, Rief W, von Blanckenburg P. Systematic mixed-method review of barriers to end-of-life communication in the family context. BMJ Support Palliat Care. 2021;11(3):253-263. https://doi.org/10.1136/bmjspcare-2020-002219ArticlePubMed
- 47. Cheng SY, Lin CP, Chan HY, Martina D, Mori M, Kim SH, et al. Advance care planning in Asian culture. Jpn J Clin Oncol. 2020;50(9):976-989. https://doi.org/10.1093/jjco/hyaa131ArticlePubMed
- 48. Moore N, Detering KM, Low T, Nolte L, Fraser S, Sellars M. Doctors’ perspectives on adhering to advance care directives when making medical decisions for patients: an Australian interview study. BMJ Open. 2019;9(10):e032638. https://doi.org/10.1136/bmjopen-2019-032638ArticlePubMedPMC
- 49. Lin CP, Cheng SY, Chen PJ. Advance care planning for older people with cancer and its implications in Asia: highlighting the mental capacity and relational autonomy. Geriatrics (Basel). 2018;3(3):43. https://doi.org/10.3390/geriatrics3030043ArticlePubMedPMC
- 50. Martina D, Lin CP, Kristanti MS, Bramer WM, Mori M, Korfage IJ, et al. Advance care planning in Asia: a systematic narrative review of healthcare professionals’ knowledge, attitude, and experience. J Am Med Dir Assoc. 2021;22(2):349. https://doi.org/10.1016/j.jamda.2020.12.018ArticlePubMed
- 51. Lee YJ, Kim SH, Yoo SH, Kim AS, Lin CP, et al. Advance care planning in palliative care in Asia: barriers and implications. J Hosp Palliat Care. 2024;27(4):107-119. https://doi.org/10.14475/jhpc.2024.27.4.107ArticlePubMedPMC
- 52. Kawachi I, Berkman LF. Social capital, social cohesion, and health. In: Berkman LF, Kawachi I, Glymour MM, editors. Social epidemiology. 2nd ed. Oxford University Press; 2014. p. 290-319. https://doi.org/10.1093/med/9780195377903.003.0008Article
- 53. Kim MJ, Lee DE, Kim JK, Yeo IH, Jung H, Kim JH, et al. Impact of the life-sustaining treatment decision act on organ donation in out-of-hospital cardiac arrests in South Korea: a multi-centre retrospective study. BMC Med Ethics. 2024;25(1):93. https://doi.org/10.1186/s12910-024-01090-4ArticlePubMedPMC
- 54. Lin SA, Xu X, Liu Y, Ai B. Mechanism of the impacts of older adults social participation on their health. Front Public Health. 2024;12:1377305. https://doi.org/10.3389/fpubh.2024.1377305ArticlePubMedPMC
- 55. Moore S, Kawachi I. Twenty years of social capital and health research: a glossary. J Epidemiol Community Health. 2017;71(5):513-517. https://doi.org/10.1136/jech-2016-208313ArticlePubMed
References
Figure & Data
REFERENCES
Citations
Citations to this article as recorded by 
 ePub Link
 Cite
CiteMultidimensional factors influencing the completion of advance directives among community-dwelling older Koreans
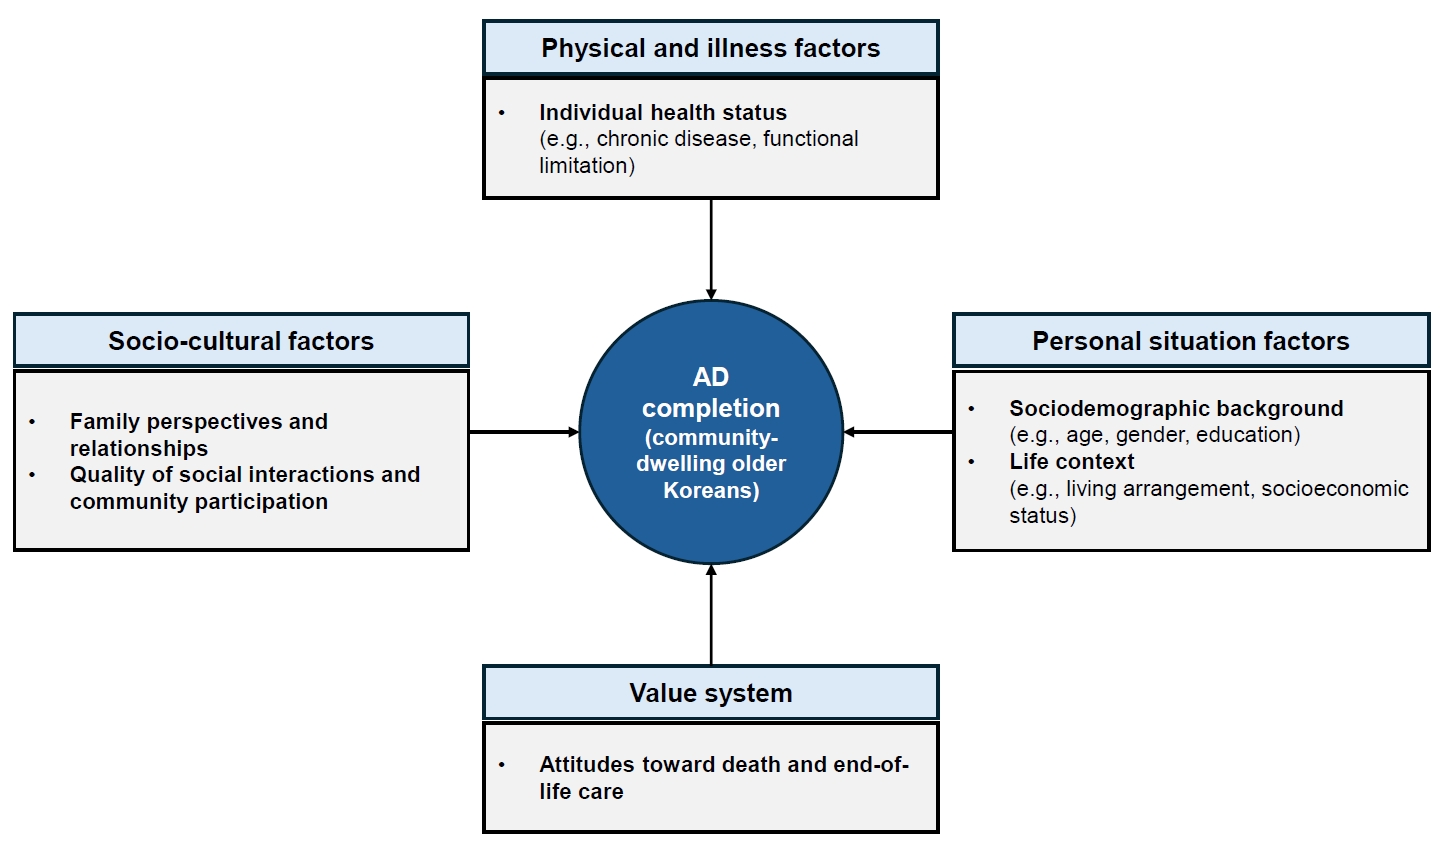
Fig. 1. Study framework: multidimensional factors associated with advance directive (AD) completion.
Fig. 1.
Multidimensional factors influencing the completion of advance directives among community-dwelling older Koreans
| Characteristic | Total | Advance directive completion | ||
|---|---|---|---|---|
| Yes | No | Rao-Scott χ2 (p)a) | ||
| Personal situation factors | ||||
| Sex | 0.13 (.722) | |||
| Male | 3,824 (44.0) | 426 (43.5) | 3,398 (44.1) | |
| Female | 6,127 (56.0) | 683(56.5) | 5,444 (55.9) | |
| Age (yr) | 2.29 (.081) | |||
| 65–69 | 3,243 (34.8) | 325 (29.7) | 2,918 (35.5) | |
| 70–79 | 4,400 (41.1) | 546 (45.9) | 3,854 (40.5) | |
| 80–89 | 2,135 (21.7) | 222 (21.9) | 1,913 (21.7) | |
| ≥90 | 173 (2.4) | 16 (2.5) | 157 (2.4) | |
| Educational level | 8.68 (<.001) | |||
| Illiterate or barely literate | 1,435 (11.9) | 121 (8.2) | 1,314 (12.4) | |
| Elementary school | 2,920 (28.2) | 346 (29.7) | 2,574 (28.0) | |
| Middle school | 2,114 (21.4) | 202 (17.7) | 1,912 (21.8) | |
| High school | 2,860 (31.5) | 317 (31.1) | 2,543 (31.5) | |
| College or more | 622 (7.1) | 123 (13.3) | 499 (6.3) | |
| Religion | 28.21 (<.001) | |||
| Yes | 4,071 (60.0) | 576 (49.3) | 3,495 (61.3) | |
| No | 5,880 (40.0) | 533 (50.7) | 5,347 (38.7) | |
| Family income level (/yr) | 1.16 (.324) | |||
| 1st quintile (lowest) | 2,107 (20.0) | 199 (18.5) | 1,908 (20.2) | |
| 2nd quintile | 2,167 (20.0) | 271 (20.1) | 1,896 (19.9) | |
| 3rd quintile (middle) | 2,026 (19.9) | 222 (18.6) | 1,804 (20.1) | |
| 4th quintile | 1,910 (20.1) | 202 (18.9) | 1,708 (20.3) | |
| 5th quintile (highest) | 1,741 (20.0) | 215 (23.9) | 1,526 (19.6) | |
| Living status | 2.25 (.088) | |||
| Lives alone | 3,423 (33.0) | 383 (33.2) | 3,040 (32.9) | |
| Lives with a spouse | 5,419 (55.3) | 647 (58.4) | 4,772 (55.0) | |
| Lives with adult children | 940 (10.0) | 68 (7.5) | 872 (10.3) | |
| Other | 169 (1.7) | 11 (0.9) | 158 (1.8) | |
| Life satisfaction | 3.23 (.043) | |||
| Good | 3,983 (40.3) | 505 (46.1) | 3,478 (39.5) | |
| Average | 5,110 (51.0) | 528 (46.5) | 4,582 (51.6) | |
| Bad | 858 (8.7) | 76 (7.5) | 782 (8.9) | |
| Housing preference in the event of poor healthb) | 4.93 (<.001) | |||
| Live at home | 4,981 (48.9) | 433 (38.6) | 4,548 (50.2) | |
| Move in with family (cohabitation) | 259 (2.5) | 32 (3.8) | 227 (2.4) | |
| Move near family (independent) | 396 (4.3) | 66 (6.0) | 330 (4.1) | |
| Senior housing residence (no insurance) | 1,489 (16.5) | 211 (22.8) | 1,278 (15.7) | |
| Senior care facility (insurance) | 2,814 (27.7) | 366 (28.8) | 2,448 (27.6) | |
| Socio-cultural factors | ||||
| Presence of children | 2.60 (.107) | |||
| Yes | 9,410 (94.0) | 1,067 (95.6) | 8,343 (93.8) | |
| No | 541 (6.0) | 42 (4.4) | 499 (6.2) | |
| Presence of friends or neighbors | 4.85 (.028) | |||
| Yes | 8,946 (89.8) | 1,027 (92.6) | 7,919 (89.5) | |
| No | 1,005 (10.2) | 82 (7.5) | 923 (10.5) | |
| Participation in social activities | 18.59 (<.001) | |||
| Yes | 5,340 (53.3) | 708 (34.6) | 4,632 (46.0) | |
| No | 4,611 (44.7) | 401 (65.4) | 4,210 (54.0) | |
| Satisfaction with social relationships | 6.43 (.002) | |||
| Good | 4,583 (45.3) | 606 (52.9) | 3,977 (44.4) | |
| Average | 4,454 (45.1) | 434 (39.6) | 4,020 (45.8) | |
| Bad | 914 (9.6) | 69 (7.5) | 845 (9.8) | |
| Physical and illness factors | ||||
| No. of chronic diseases | 6.21 (<.001) | |||
| 0 | 1,363 (14.1) | 97 (10.7) | 1,266 (14.4) | |
| 1 | 2,163 (22.2) | 184 (18.2) | 1,979 (22.7) | |
| 2 | 2,744 (28.1) | 308 (27.3) | 2,436 (28.2) | |
| ≥3 | 3,681 (35.6) | 520 (43.8) | 3,161 (34.6) | |
| Overall functional status | 1.20 (.274) | |||
| Limited | 1,648 (17.7) | 190 (19.7) | 1,458 (17.4) | |
| Unlimited | 8,303 (82.3) | 919 (80.3) | 7,384 (82.6) | |
| Value system | ||||
| Awareness of hospice and palliative services | 12.62 (<.001) | |||
| Yes | 1,355 (16.0) | 242 (26.5) | 1,113 (14.7) | |
| Heard of | 4,195 (43.4) | 394 (37.8) | 3,801 (44.1) | |
| None | 4,401 (40.5) | 473 (35.7) | 3,928 (41.2) | |
| Participation in death preparedness education | 58.18 (<.001) | |||
| Yes | 297 (4.2) | 115 (13.6) | 182 (3.0) | |
| No | 9,654 (95.8) | 994 (86.4) | 8,660 (97.0) | |
| Documentation of organ donation | 194.88 (<.001) | |||
| Yes | 361 (4.5) | 162 (14.6) | 199 (2.3) | |
| No | 9,590 (95.5) | 947 (85.4) | 8,643 (97.7) | |
| Independent variable | Classification | Advance directive completion | |||
|---|---|---|---|---|---|
| Crude | Adjusted | ||||
| OR (95% CI)a) | p | aOR (95% CI)a) | p | ||
| Personal situation factors | |||||
| Sex (ref: male) | Female | 1.03 (0.89–1.18) | .721 | 1.10 (0.93–1.30) | .269 |
| Age (yr) (ref: 65–69) | 70–79 | 1.36 (1.11–1.65) | .003 | 1.50 (1.19–1.90) | .001 |
| 80–89 | 1.21 (0.90–1.62) | .214 | 1.68 (1.13–2.50) | .011 | |
| ≥90 | 1.28 (0.64–2.57) | .486 | 1.65 (0.77–3.55) | .199 | |
| Educational level (ref: illiterate or barely literate) | Elementary school | 1.60 (1.17–2.20) | .003 | 1.54 (1.11–2.12) | .009 |
| Middle school | 1.23 (0.88–1.72) | .234 | 1.23 (0.85–1.79) | .271 | |
| High school | 1.49 (1.06–2.10) | .022 | 1.47 (0.98–2.20) | .063 | |
| College or more | 3.20 (2.01–5.09) | <.001 | 2.79 (1.60–4.84) | <.001 | |
| Religion (ref: no) | Yes | 1.63 (1.36–1.95) | <.001 | 1.30 (1.09–1.54) | .004 |
| Family income level (/yr) (ref: 1st quintile) | 2nd quintile | 1.10 (0.83–1.50) | .502 | 1.21 (0.94–1.57) | .141 |
| 3rd quintile (middle) | 1.01 (0.72–1.43) | .942 | 1.03 (0.75–1.41) | .845 | |
| 4th quintile | 1.02 (0.72–1.43) | .926 | 1.02 (0.74-1.40) | .915 | |
| 5th quintile (highest) | 1.33 (0.92–1.93) | .128 | 1.34 (0.92–1.96) | .127 | |
| Living status (ref: lives alone) | Lives with a spouse | 1.06 (0.86–1.30) | 0.61 | 1.11 (0.89–1.38) | .337 |
| Lives with adult children | 0.72 (0.47–1.11) | 0.14 | 0.71 (0.45–1.11) | .130 | |
| Other | 0.52 (0.25–1.06) | 0.07 | 0.67 (0.33–1.38) | .276 | |
| Life satisfaction (ref: bad) | Average | 1.07 (0.74–1.54) | .723 | 0.93 (0.61–1.43) | .756 |
| Good | 1.38 (0.91–2.11) | .134 | 0.94 (0.57–1.56) | .814 | |
| Housing preference in the event of poor health (ref: lives at home) | Move in with family (cohabitation) | 2.13 (1.28–3.53) | .003 | 1.98 (1.20–3.30) | .008 |
| Move near family (independent) | 1.91 (1.13–3.21) | .015 | 1.69 (1.05–2.73) | .030 | |
| Senior housing residence (no insurance) | 1.88 (1.37–2.59) | <.001 | 1.51 (1.11–2.04) | .008 | |
| Senior care facility (insurance) | 1.35 (0.99–1.84) | .054 | 1.47 (1.09–1.98) | .013 | |
| Socio-cultural factors | |||||
| Presence of children (ref: no) | Yes | 1.44 (0.92–2.23) | .109 | 1.57 (1.01–2.44) | .046 |
| Presence of friends or neighbors (ref: no) | Yes | 1.46 (1.04–2.04) | .029 | 1.26 (0.88–1.81) | .203 |
| Social activity participation (ref: no) | 1.61 (1.30–2.01) | <.001 | 1.42 (1.12–1.80) | .004 | |
| Social relationship satisfaction (ref: bad) | Average | 1.13 (0.80–1.61) | .481 | 1.23 (0.81–1.86) | .320 |
| Good | 1.56 (1.08–2.25) | .017 | 1.58 (1.03–2.41) | .037 | |
| Physical and illness factors | |||||
| Number of chronic diseases (ref: 0) | 1 | 1.08 (0.78–1.51) | .643 | 1.23 (0.89–1.70) | .200 |
| 2 | 1.31 (0.92–1.86) | .136 | 1.50 (1.06–2.13) | .022 | |
| ≥3 | 1.71 (1.18–2.48) | .005 | 2.07 (1.43–3.00) | <.001 | |
| Overall functional status (ref: limited) | Unlimited | 0.86 (0.65–1.13) | .275 | 0.98 (0.75–1.27) | .878 |
| Value system | |||||
| Awareness of hospice and palliative service (ref: no) | Heard of | 0.99 (0.76–1.28) | .923 | 0.87 (0.67–1.13) | .307 |
| Yes | 2.07 (1.42–3.02) | <.001 | 1.53 (1.06–2.20) | .023 | |
| Participation in death preparedness education (ref: no) | 5.05 (3.20–7.98) | <.001 | 2.58 (1.57–4.24) | <.001 | |
| Documentation of organ donation (ref: no) | 7.63 (5.49–10.59) | <.001 | 5.32 (3.27–8.67) | <.001 | |
Table 1. Comparison of characteristics by advance directive completion status (N=9,951)
Values are presented as unweighted frequency (weighted %), unless otherwise stated. Weighted percentages are presented. Percentages may not total 100 because of rounding. a)Rao-Scott χ2 test using complex sample design. b)“Other” responses excluded (n=12).
Table 2. Factors associated with advance directive completion (N=9,951)
aOR, adjusted odds ratio; CI, confidence interval; OR, odds ratio; Ref, reference group. a)Complex sample analysis was conducted to aid in survey design and weighting.

