 E-SUBMISSION
Articles
- Page Path
- HOME > J Korean Acad Nurs > Volume 55(2); 2025 > Article
-
Research Paper
- The effects of a lifestyle intervention for men in infertile couples in South Korea: a non-randomized controlled trial
-
Yun Mi Kim1
 , Ju-Hee Nho2
 -
Journal of Korean Academy of Nursing 2025;55(2):191-204.
DOI: https://doi.org/10.4040/jkan.24104
Published online: April 16, 2025
1Department of Nursing, Jesus University, Jeonju, Korea
2College of Nursing, Research Institute of Nursing Science, Jeonbuk National University, Jeonju, Korea
- Corresponding author: Ju-Hee Nho College of Nursing, Research Institute of Nursing Science, Jeonbuk National University, 567 Baekje-daero, Deokjin-gu, Jeonju 54896, Korea E-mail: jhnho@jbnu.ac.kr
- *This manuscript is a condensed version of the first author’s doctoral dissertation from Jeonbuk National University (2023). This work was presented at the 59th Korean Society of Women Health Nursing Conference in 2023, Daejeon, Republic of Korea.
• Received: August 20, 2024 • Revised: March 6, 2025 • Accepted: March 6, 2025
© 2025 Korean Society of Nursing Science
This is an Open Access article distributed under the terms of the Creative Commons Attribution NoDerivs License (http://creativecommons.org/licenses/by-nd/4.0) If the original work is properly cited and retained without any modification or reproduction, it can be used and re-distributed in any format and medium.

Figure & Data
REFERENCES
Citations
Citations to this article as recorded by 
- Psychological Stress and Male Infertility: Oxidative Stress as the Common Downstream Pathway
Aris Kaltsas, Stamatis Papaharitou, Fotios Dimitriadis, Michael Chrisofos, Nikolaos Sofikitis
Biomedicines.2026; 14(2): 259. CrossRef
 ePub Link
 Cite
CiteThe effects of a lifestyle intervention for men in infertile couples in South Korea: a non-randomized controlled trial
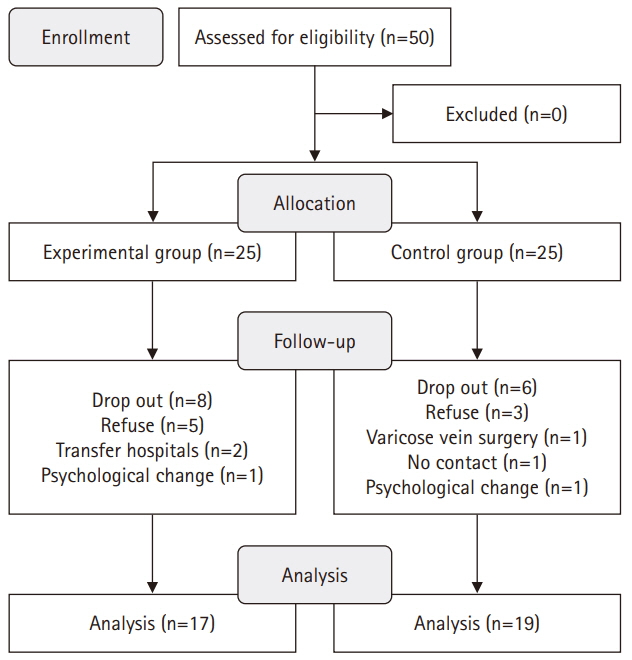
Fig. 1. Study flow chart.
Fig. 1.
The effects of a lifestyle intervention for men in infertile couples in South Korea: a non-randomized controlled trial
| Session: 1, 3, 5, 7, 9, 11, 13, 15 (every Tuesday for 8 weeks) | Session: 2, 4, 6, 8, 10, 12, 14, 16 (every Friday for 8 weeks) | Session: daily | Elements of client professional interaction | |||
|---|---|---|---|---|---|---|
| Education | Method | Feedback | Method | Monitoring | Method | |
| Reproductive health education | Digital short message service | Consultation | Telephone | Self-checking | Wearable device | Client professional interaction |
| - Reproductive health for men and women | - Individualized feedback | - Assessing the lifestyle patterns via lifestyle checklist | Uniform resource locator | - Text messages | ||
| - Lifestyle factors affecting fertility | - Recommendations on optimizing their physical activity, dietary habits, and stress management strategies. | - Monitoring | ||||
| - Lifestyle modification strategies for optimizing reproductive outcomes | - Telephone consultations and monitoring | |||||
| Physical activity management | - Assessment of exercise, diet, and stress status | |||||
| - Intensity and method of walking | Health information | |||||
| - Methods of strength training and aerobic exercise | - Education and information | |||||
| - Precautions during physical activity | - Knowledge reinforcement | |||||
| - How to use a smart band and a physical activity diary | Professional/technical competencies | |||||
| Nutritional management | - Telephone and individual counseling | |||||
| - Men’s healthy diet and nutrition education | - Decisional control: phone calls and mobile messages | |||||
| - Nutrition label confirmation | Affective support | |||||
| - Nutritional education related to reproductive health | - Praise | |||||
| - 24-hour dietary recall | - Encouragement | |||||
| Stress management | - Support | |||||
| - Relaxation and mindfulness techniques (meditation, bedtime relaxation) | ||||||
| - Talking with one’s spouse (before going to bed, taking a walk) | ||||||
| - Sufficient sleep (about 7 hours) | ||||||
| - Light walking with one’s spouse | ||||||
| Characteristic | Exp. (n=17) | Cont. (n=19) | χ2 or t or z | p |
|---|---|---|---|---|
| n (%)/M±SD/med (IQR) | ||||
| Age (yr) | 0.15 | .881 | ||
| ≤30 | 1 (5.9) | 0 (0.0) | ||
| 31–34 | 5 (29.4) | 8 (42.1) | ||
| 35–40 | 5 (29.4) | 5 (26.3) | ||
| ≥41 | 6 (35.3) | 6 (31.6) | ||
| Mean±SD | 37.24±4.76 | 38.00±5.16 | ||
| Age of spouse (yr) | 0.99 | .804 | ||
| ≤30 | 3 (17.7) | 2 (10.5) | ||
| 31–34 | 5 (29.4) | 8 (42.1) | ||
| 35–40 | 4 (23.5) | 4 (21.1) | ||
| ≥41 | 5 (29.4) | 5 (26.3) | ||
| Mean±SD | 34.94±4.48 | 35.42±4.49 | ||
| Marriage duration (mo) | 5.55 | .136 | ||
| ≤24 | 3 (17.7) | 5 (26.3) | ||
| 25–36 | 5 (29.4) | 5 (26.3) | ||
| 37–48 | 4 (23.5) | 0 (0.0) | ||
| ≥49 | 5 (29.4) | 9 (47.4) | ||
| Mean±SD | 49.18±35.91 | 53.89±36.18 | ||
| Religion | 1.99 | .192 | ||
| Yes | 12 (70.6) | 9 (47.4) | ||
| No | 5 (29.4) | 10 (52.6) | ||
| Education | 0.96 | .434 | ||
| ≤High school | 5 (29.4) | 3 (15.8) | ||
| ≥University | 12 (70.6) | 16 (84.2) | ||
| Chronic disease | 0.01 | >.999 | ||
| Yes | 1 (5.9) | 1 (5.3) | ||
| No | 16 (94.1) | 18 (94.7) | ||
| Monthly individual income (10,000 KRW) | 1.14 | .887 | ||
| <200 | 1 (5.9) | 1 (5.3) | ||
| 200–299 | 5 (29.4) | 6 (31.6) | ||
| 300–399 | 3 (17.7) | 2 (10.5) | ||
| 400–499 | 4 (23.5) | 3 (15.8) | ||
| ≥500 | 4 (23.5) | 7 (36.8) | ||
| Alcohol consumption | 0.63 | .502 | ||
| Yes | 12 (70.6) | 11 (57.9) | ||
| No | 5 (29.4) | 8 (42.1) | ||
| Smoking | 0.39 | .695 | ||
| Yes | 3 (17.7) | 5 (26.3) | ||
| No | 14 (82.3) | 14 (73.7) | ||
| Physical activity | 0.01 | >.999 | ||
| Yes | 6 (35.3) | 7 (36.8) | ||
| No | 11 (64.7) | 12 (63.2) | ||
| Sleeping hours (hr) | 2.73 | .158 | ||
| <3 | 1 (5.9) | 0 (0.0) | ||
| 3–5 | 7 (41.2) | 2 (10.5) | ||
| 6–7 | 7 (41.2) | 14 (73.7) | ||
| ≥8 | 2 (11.7) | 3 (15.8) | ||
| Body mass index (kg/m2) | 26.07±3.39 | 25.40±3.11 | 0.62 | .540 |
| Normal (18.5–24.9) | 8 (47.1) | 6 (35.3) | ||
| Overweight (18.5–24.9) | 5 (29.4) | 6 (35.3) | 1.12 | .570 |
| Obesity (≥30.0) | 4 (23.5) | 5 (29.4) | ||
| Semen analysis experience | 0.39 | .736 | ||
| Yes | 8 (47.1) | 7 (36.8) | ||
| No | 9 (52.9) | 12 (63.2) | ||
| Health-promoting behaviors | 117.00 (IQR, 109.00) | 113.00 (IQR, 104.00) | –0.65a) | .516 |
| Infertility stress | 166.00±19.98 | 149.58±27.55 | 2.03 | .051 |
| Fertility-related quality of life | 72.37±11.47 | 70.27±10.89 | 0.56 | .577 |
| Volume (mL) (n=30) | 4.00 (IQR, 3.00) | 3.50 (IQR, 2.75) | –0.49a) | .626 |
| Total motility (%) (n=30) | 64.98 (IQR, 41.39) | 83.84 (IQR, 76.33) | –2.03a) | .042 |
| Immobility (%) (n=30) | 35.02 (IQR, 13.60) | 16.16 (IQR< 8.86) | 2.97a) | .007 |
| Concentration (million/mL) (n=30) | 25.53 (IQR, 13.26) | 36.40 (IQR, 21.25) | –1.57a) | .117 |
| Normal morphology (%) (n=30) | 9.98 (IQR, 8.12) | 19.76 (IQR, 11.74) | –1.47a) | .143 |
| Variable | Pre-test | Post-test | Difference | z or t or F | p |
|---|---|---|---|---|---|
| Med (IQR)/M±SD | |||||
| Health promoting behaviors | –2.27a) | .023 | |||
| Exp. (n=17) | 117.00 (109.00) | 132.00 (125.00) | 8.00 (1.00) | ||
| Cont. (n=19) | 113.00 (104.00) | 119.00 (104.00) | –1.00 (–5.00) | ||
| Infertility stress | –2.40b) | .022 | |||
| Exp. (n=17) | 166.00±19.98 | 114.53±22.59 | –51.47±34.35 | ||
| Cont. (n=19) | 149.58±27.55 | 126.79±26.00 | –22.79±37.18 | ||
| Fertility-related quality of life | 0.63b) | .531 | |||
| Exp. (n=17) | 72.37±11.47 | 74.12±6.88 | 1.76±10.08 | ||
| Cont. (n=19) | 70.26±10.89 | 69.70±11.74 | –0.57±11.74 | ||
| Volume (mL) (n=30) | –0.49a) | .626 | |||
| Exp. (n=17) | 4.00 (3.00) | 4.00 (4.00) | 0.00 (0.00) | ||
| Cont. (n=13) | 3.50 (2.75) | 3.00 (2.00) | 0.00 (0.00) | ||
| Total motility (%) (n=30) | 4.39c) | .045 | |||
| Exp. (n=17) | 64.98 (41.39) | 86.09 (72.83) | 16.33 (1.67) | ||
| Cont. (n=13) | 83.84 (76.33) | 90.43 (70.24) | 0.00 (–8.74) | ||
| Immobility (%) (n=30) | 2.04c) | .164 | |||
| Exp. (n=17) | 35.02 (13.60) | 13.92 (10.98) | –16.33 (–31.45) | ||
| Cont. (n=13) | 16.16 (8.86) | 9.57 (6.40) | –0.61 (–8.54) | ||
| Concentration (million/mL) (n=30) | –1.57a) | .117 | |||
| Exp. (n=17) | 25.53 (13.26) | 34.41 (17.67) | 3.92 (–4.44) | ||
| Cont. (n=13) | 36.40 (21.25) | 51.11 (21.79) | 2.03 (–6.80) | ||
| Normal morphology (%) (n=30) | 2.86a) | .017 | |||
| Exp. (n=17) | 9.98 (8.12) | 23.55 (9.91) | 2.52 (0.02) | ||
| Cont. (n=13) | 19.76 (11.74) | 17.48 (9.95) | –0.23 (–10.24) | ||
Table 1. IMCHB-based lifestyle intervention for men in infertile couples
IMCHB, interaction model of client health behavior.
Table 2. Homogeneity of general characteristics and variables between groups (N=36)
Values are presented as number (%), mean±SD, or median (IQR). Cont., control group; Exp., experimental group; IQR, interquartile range; KRW, Korean won; SD, standard deviation. By Mann-Whitney U test.
Table 3. Effects of the IMCHB-based lifestyle intervention for men in infertile couples (N=36)
Values are presented as median (interquartile range) or mean±standard deviation. Cont., control group; Exp., experimental group; IMCHB, interaction model of client health behavior. a)By Mann-Whitney U test. b)By independent t-test. c)By ranked analysis of covariance (covariate: pre-test score of total motility and immobility).

