Articles
- Page Path
- HOME > J Korean Acad Nurs > Volume 55(2); 2025 > Article
-
Research Paper
한국 성인의 중성지방-혈당 관련 지표와 당뇨병 발생의 연관성: 코호트 연구를 활용한 이차분석 -
박유진1,2
 , 신미선1
 , 전현선1
 , 양은희1,2
- Triglyceride-glucose parameters as predictors of diabetes mellitus incidence in Korean adults: a secondary analysis of a Prospective Cohort Study
-
Yu Jin Park1,2
 , Miseon Shin1
 , Hyun Seon Jeon1
 , Eun Hee Yang1,2
-
Journal of Korean Academy of Nursing 2025;55(2):205-221.
DOI: https://doi.org/10.4040/jkan.24108
Published online: April 1, 2025
1전북대학교 일반대학원 간호학과
2전북대학교병원 간호부
1Department of Nursing, Graduate School, Jeonbuk National University, Jeonju, Korea
2Department of Nursing, Jeonbuk National University Hospital, Jeonju, Korea
- Corresponding author: Miseon Shin Department of Nursing, Jeonbuk National University, 567 Baekje-daero, Deokjin-gu, Jeonju 54896, Korea E-mail: shinms@jbnu.ac.kr
- †This work was presented at 89th Korean Society of Nursing Science Conference, October, 2024, Seoul, Korea.
© 2025 Korean Society of Nursing Science
This is an Open Access article distributed under the terms of the Creative Commons Attribution NoDerivs License (http://creativecommons.org/licenses/by-nd/4.0) If the original work is properly cited and retained without any modification or reproduction, it can be used and re-distributed in any format and medium.
- 2,215 Views
- 145 Download
Abstract
-
Purpose
- This study aimed to evaluate the association between triglyceride-glucose (TyG)–related parameters and the incidence of diabetes mellitus in Korean adults. Data were obtained from the Korean Genome and Epidemiology Study (KoGES).
-
Methods
- This secondary analysis examined data from 6,816 adults aged 40–69 years who participated in the KoGES from 2001 to 2020. TyG–related parameters, including the TyG index, TyG–body mass index (TyG–BMI), TyG–waist circumference (TyG–WC), and TyG–waist-to-height ratio (TyG–WHtR), were assessed. Cox proportional hazards models were employed to determine the association between these parameters and the incidence of diabetes mellitus, with adjustments made for demographic, lifestyle, and health-related characteristics.
-
Results
- Higher levels of all TyG–related parameters were significantly associated with an increased risk of developing diabetes mellitus. Specifically, participants in the highest quartile of the TyG index, TyG–BMI, TyG–WC, and TyG–WHtR exhibited significantly higher hazard ratios for diabetes mellitus incidence compared with those in the lowest quartile (p<.001 for all). Notably, the TyG index demonstrated a stronger predictive value for diabetes mellitus than traditional measures such as the homeostatic model assessment of insulin resistance.
-
Conclusion
- TyG–related parameters are robust predictors of diabetes mellitus incidence in Korean adults. These findings support the incorporation of TyG–related measures into clinical settings for the early identification and intervention of high-risk populations. Utilizing these parameters for early diagnosis and preventive strategies may significantly enhance diabetes mellitus management.
서론
방법
1) 독립변수
2) 종속변수
3) 혼동변수
결과
고찰
결론
-
Conflicts of Interest
No potential conflict of interest relevant to this article was reported.
-
Acknowledgements
None.
-
Funding
This study was provided with bioresources from CODA in National Biobank of Korea, the Agency for Disease Control and Prevention, Republic of Korea.
-
Data Sharing Statement
Please contact the corresponding author for data availability.
-
Author Contributions
Conceptualization or/and Methodology: YJP, MS, HSJ, EHY. Data curation or/and Analysis: YJP, MS. Funding acquisition: none. Investigation: YJP, MS, HSJ, EHY. Project administration or/and Supervision: YJP, MS. Resources or/and Software: YJP, MS, HSJ, EHY. Validation: HSJ, EHY. Visualization: YJP. Writing: original draft or/and Review & Editing: YJP, MS, HSJ, EHY. Final approval of the manuscript: all authors.
Article Information


| Classification | HR (95% CI) | p |
|---|---|---|
| TyG index (ref: low) | 1.47 (1.34–1.62) | <.001 |
| TyG–BMI (ref: low) | 1.38 (1.25–1.52) | <.001 |
| TyG–WC (ref: low) | 1.41 (1.29–1.53) | <.001 |
| TyG–WHtR (ref: low) | 1.43 (1.31–1.56) | <.001 |
The references were TyG index (low), TyG–BMI (low), TyG–WC (low), and TyG–WHtR (low). The controlled variables were demographic, lifestyle, and health-related characteristics.
CI, confidence interval; HR, hazard ratio; TyG, triglyceride-glucose; TyG–BMI, triglyceride-glucose–body mass index; TyG index, triglyceride-glucose index; TyG–WC, triglyceride-glucose–waist circumference; TyG–WHtR, triglyceride glucose–waist-to-height ratio.
- 1. World Health Organization. Diabetes 2021 [Internet]. World Health Organization; 2021 [cited 2025 Jan 10]. Available from: https://www.who.int/news-room/fact-sheets/detail/diabetes
- 2. Saeedi P, Petersohn I, Salpea P, Malanda B, Karuranga S, Unwin N, et al. Global and regional diabetes prevalence estimates for 2019 and projections for 2030 and 2045: results from the International Diabetes Federation Diabetes Atlas, 9th edition. Diabetes Res Clin Pract. 2019;157:107843. https://doi.org/10.1016/j.diabres.2019.107843ArticlePubMed
- 3. Sun H, Saeedi P, Karuranga S, Pinkepank M, Ogurtsova K, Duncan BB, et al. IDF Diabetes Atlas: global, regional and country-level diabetes prevalence estimates for 2021 and projections for 2045. Diabetes Res Clin Pract. 2022;183:109119. https://doi.org/10.1016/j.diabres.2021.109119ArticlePubMedPMC
- 4. Magliano DJ, Boyko EJ; IDF Diabetes Atlas 10th edition scientific committee. IDF Diabetes Atlas [Internet]. 10th ed. International Diabetes Federation; 2021 [cited 2025 Jan 10]. Available from: https://pubmed.ncbi.nlm.nih.gov/35914061/
- 5. Bae JH, Han KD, Ko SH, Yang YS, Choi JH, Choi KM, et al. Diabetes fact sheet in Korea 2021. Diabetes Metab J. 2022;46(3):417-426. https://doi.org/10.4093/dmj.2022.0106ArticlePubMedPMC
- 6. Fukuda H, Mizobe M. Impact of nonadherence on complication risks and healthcare costs in patients newly-diagnosed with diabetes. Diabetes Res Clin Pract. 2017;123:55-62. https://doi.org/10.1016/j.diabres.2016.11.007ArticlePubMed
- 7. Ghandour R, Mikki N, Abu Rmeileh NM, Jerdén L, Norberg M, Eriksson JW, et al. Complications of type 2 diabetes mellitus in Ramallah and al-Bireh: the Palestinian Diabetes Complications and Control Study (PDCCS). Prim Care Diabetes. 2018;12(6):547-557. https://doi.org/10.1016/j.pcd.2018.07.002ArticlePubMed
- 8. Xing Y, Liu J, Gao Y, Zhu Y, Zhang Y, Ma H. Stronger associations of TyG index with diabetes than TyG-obesity-related parameters: more pronounced in young, middle-aged, and women. Diabetes Metab Syndr Obes. 2023;16:3795-3805. https://doi.org/10.2147/DMSO.S433493ArticlePubMedPMC
- 9. National Health Insurance Service. Medical aid statistics 2022 [Internet]. National Health Insurance Service; 2022 [cited 2025 Jan 10]. Available from: https://www.nhis.or.kr/nhis/together/wbhaec06500m01.do?mode=view&articleNo=10839093&article.offset=0&articleLimit=10
- 10. George C, Echouffo-Tcheugui JB, Jaar BG, Okpechi IG, Kengne AP. The need for screening, early diagnosis, and prediction of chronic kidney disease in people with diabetes in low- and middle-income countries: a review of the current literature. BMC Med. 2022;20(1):247. https://doi.org/10.1186/s12916-022-02438-6ArticlePubMedPMC
- 11. DeFronzo RA. Lilly Lecture 1987. The triumvirate: beta-cell, muscle, liver: a collusion responsible for NIDDM. Diabetes. 1988;37(6):667-687. https://doi.org/10.2337/diab.37.6.667ArticlePubMed
- 12. Shin KA, Hong SB, Shin KS. Body adiposity index and metabolic syndrome risk factors in Korean adults: a comparison with body mass index and other parameters. Biomed Sci Lett. 2017;23(2):57-63. https://doi.org/10.15616/BSL.2017.23.2.57Article
- 13. Yun YS, Park SW, Song YD, Park HK, Kim OY, Ahn CW, et al. Limitation of validity of homeostasis model assessment as a index of insulin resistance. J Korean Diabetes Assoc. 2000;24(5):541-551.
- 14. Simental-Mendía LE, Rodríguez-Morán M, Guerrero-Romero F. The product of fasting glucose and triglycerides as surrogate for identifying insulin resistance in apparently healthy subjects. Metab Syndr Relat Disord. 2008;6(4):299-304. https://doi.org/10.1089/met.2008.0034ArticlePubMed
- 15. Dikaiakou E, Vlachopapadopoulou EA, Paschou SA, Athanasouli F, Panagiotopoulos Ι, Kafetzi M, et al. Τriglycerides-glucose (TyG) index is a sensitive marker of insulin resistance in Greek children and adolescents. Endocrine. 2020;70(1):58-64. https://doi.org/10.1007/s12020-020-02374-6ArticlePubMed
- 16. Fritz J, Bjørge T, Nagel G, Manjer J, Engeland A, Häggström C, et al. The triglyceride-glucose index as a measure of insulin resistance and risk of obesity-related cancers. Int J Epidemiol. 2020;49(1):193-204. https://doi.org/10.1093/ije/dyz053ArticlePubMed
- 17. Lee SB, Kim MK, Kang S, Park K, Kim JH, Baik SJ, et al. Triglyceride glucose index is superior to the homeostasis model assessment of insulin resistance for predicting nonalcoholic fatty liver disease in Korean adults. Endocrinol Metab (Seoul). 2019;34(2):179-186. https://doi.org/10.3803/EnM.2019.34.2.179ArticlePubMedPMC
- 18. Vasques AC, Novaes FS, de Oliveira Mda S, Souza JR, Yamanaka A, Pareja JC, et al. TyG index performs better than HOMA in a Brazilian population: a hyperglycemic clamp validated study. Diabetes Res Clin Pract. 2011;93(3):e98-e100. https://doi.org/10.1016/j.diabres.2011.05.030ArticlePubMed
- 19. Abbasi F, Reaven GM. Comparison of two methods using plasma triglyceride concentration as a surrogate estimate of insulin action in nondiabetic subjects: triglycerides × glucose versus triglyceride/high-density lipoprotein cholesterol. Metabolism. 2011;60(12):1673-1676. https://doi.org/10.1016/j.metabol.2011.04.006ArticlePubMed
- 20. Miao H, Zhou Z, Yang S, Zhang Y. The association of triglyceride-glucose index and related parameters with hypertension and cardiovascular risk: a cross-sectional study. Hypertens Res. 2024;47(4):877-886. https://doi.org/10.1038/s41440-023-01502-9ArticlePubMed
- 21. Lim J, Kim J, Koo SH, Kwon GC. Comparison of triglyceride glucose index, and related parameters to predict insulin resistance in Korean adults: an analysis of the 2007-2010 Korean National Health and Nutrition Examination Survey. PLoS One. 2019;14(3):e0212963. https://doi.org/10.1371/journal.pone.0212963ArticlePubMedPMC
- 22. Zheng S, Shi S, Ren X, Han T, Li Y, Chen Y, et al. Triglyceride glucose-waist circumference, a novel and effective predictor of diabetes in first-degree relatives of type 2 diabetes patients: cross-sectional and prospective cohort study. J Transl Med. 2016;14(1):260. https://doi.org/10.1186/s12967-016-1020-8ArticlePubMedPMC
- 23. Bae JH. Association between triglyceride glucose index and prediabetes: a cross-sectional study of KNHANES [master's thesis]. Yonsei University; 2023. [cited 2025 Jan 10]. Available from: https://dcollection.yonsei.ac.kr/public_resource/pdf/000000550460_20250324090613.pdf
- 24. Na KH. Association between TyG-related parameters and prediabetes: a cross-sectional study of KNHANES (2019-2021). Yonsei University; 2024.
- 25. Nathan DM, Davidson MB, DeFronzo RA, Heine RJ, Henry RR, Pratley R, et al. Impaired fasting glucose and impaired glucose tolerance: implications for care. Diabetes Care. 2007;30(3):753-759. https://doi.org/10.2337/dc07-9920ArticlePubMed
- 26. Korean Diabetes Association. "What is diabetes?" [Internet]. Korean Diabetes Association; [date unknown]; [cited 2025 Jan 10]. Available from: https://old.diabetes.or.kr/general/class/index.php?idx=5
- 27. Korean Diabetes Association. Clinical practice guidelines for obesity 2022 [Internet]. Korean Diabetes Association; 2022 [cited 2025 Jan 10]. Available from: https://general.kosso.or.kr/html/?pmode=BBBS0001300003&page=1&smode=view&seq=1383&searchValue=&searchTitle=strTitle
- 28. Hsieh SD, Yoshinaga H, Muto T. Waist-to-height ratio, a simple and practical index for assessing central fat distribution and metabolic risk in Japanese men and women. Int J Obes Relat Metab Disord. 2003;27(5):610-616. https://doi.org/10.1038/sj.ijo.0802259ArticlePubMed
- 29. Ashwell M, Gunn P, Gibson S. Waist-to-height ratio is a better screening tool than waist circumference and BMI for adult cardiometabolic risk factors: systematic review and meta-analysis. Obes Rev. 2012;13(3):275-286. https://doi.org/10.1111/j.1467-789X.2011.00952.xArticlePubMed
- 30. Lee CM, Huxley RR, Wildman RP, Woodward M. Indices of abdominal obesity are better discriminators of cardiovascular risk factors than BMI: a meta-analysis. J Clin Epidemiol. 2008;61(7):646-653. https://doi.org/10.1016/j.jclinepi.2007.08.012ArticlePubMed
- 31. Chung HS, Seo JA, Kim SG, Kim NH, Kim DM, Chung CH, et al. Relationship between metabolic syndrome and risk of chronic complications in Koreans with type 2 diabetes. Diabetes Metab J. 2009;33(5):392-400. https://doi.org/10.4093/kdj.2009.33.5.392Article
References
Appendix
Appendix 1.
Appendix 2.
Appendix 3.

Appendix 4.

Figure & Data
REFERENCES
Citations


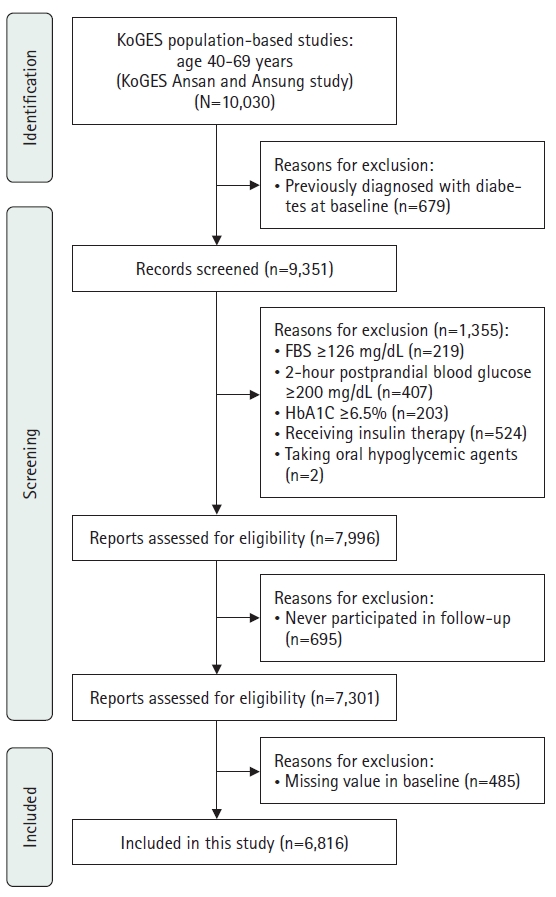
Fig. 1.
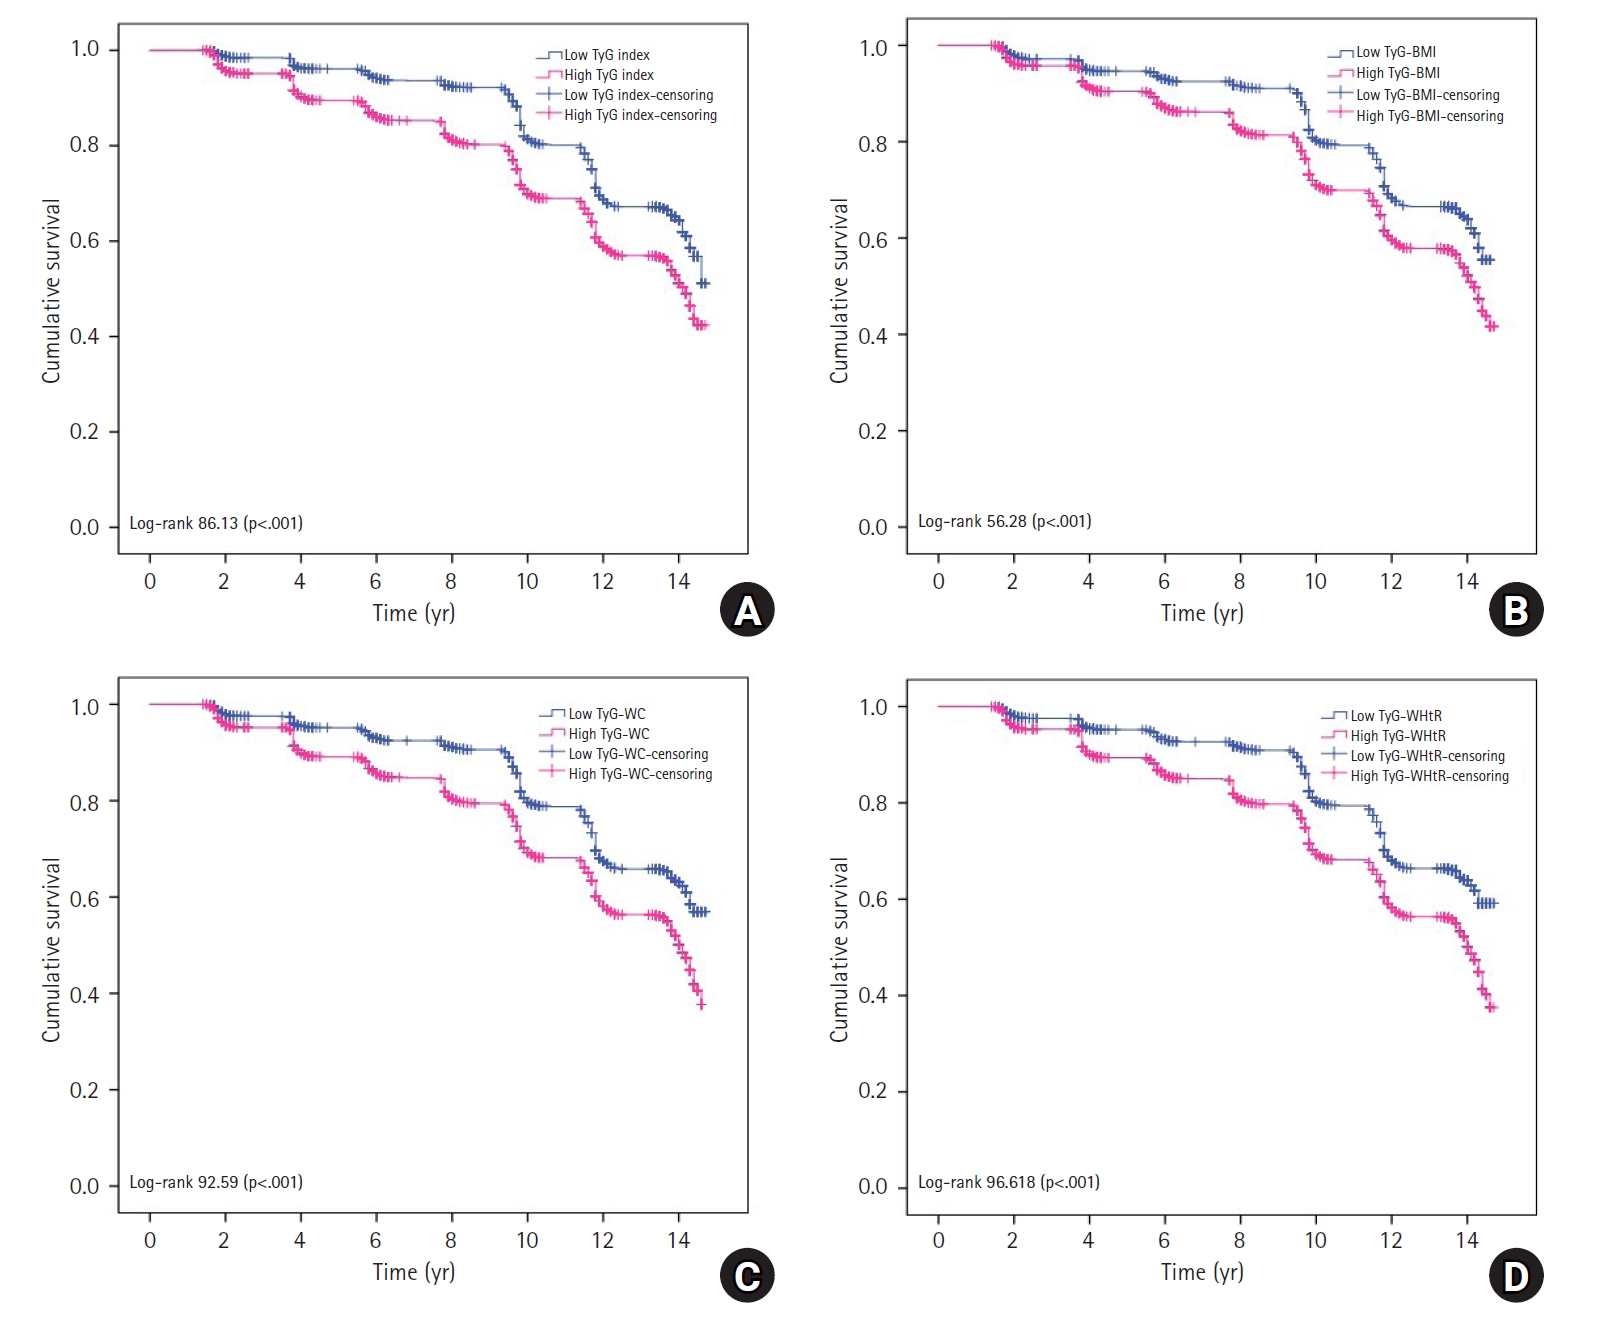
Fig. 2.
| Characteristic | No. (%) | DM |
HR (95% CI) | p-value | ||
|---|---|---|---|---|---|---|
| No. of incidence case (%) | Person-year incidence | Incidence rate per 1,000 person-years | ||||
| Total | 6,816 (100) | 6,795 (99.7) | 68,698.20 | 98.91 | ||
| Gender | ||||||
| Men | 3,212 (47.1) | 3,206 (46.0) | 31,631.30 | 101.36 | 1 | |
| Women | 3,604 (52.9) | 3,589 (54.0) | 37,066.90 | 96.82 | 0.88 (0.08–1.01) | .072 |
| Age (yr) | ||||||
| 40–49 | 3,546 (52.0) | 3,534 (54.0) | 37,121.70 | 95.20 | 1 | |
| 50–59 | 1,711 (25.1) | 1,707 (25.3) | 17,369.70 | 98.27 | 1.19 (1.07–1.31) | .001 |
| 60–69 | 1,559 (22.9) | 1,554 (20.7) | 14,206.80 | 109.38 | 1.22 (1.08–1.37) | .001 |
| Marital status | ||||||
| Unmarried | 83 (1.2) | 83 (1.1) | 796.90 | 104.15 | 1 | |
| Married | 6,216 (91.2) | 6,197 (91.8) | 63,032.00 | 98.32 | 0.87 | |
| Others (divorced, separated, widowed) | 517 (7.6) | 515 (7.1) | 4,869.30 | 105.76 | 0.91 (0.63–1.34) | .641 |
| Occupation | ||||||
| Professional | 301 (4.4) | 301 (4.4) | 3,056.20 | 98.49 | 1 | |
| Non-professional | 6,515 (95.6) | 6,494 (95.6) | 65,642.00 | 98.93 | 1.01 (0.83–1.23) | .948 |
| Monthly income (10,000 won) | ||||||
| <200 | 4,214 (61.8) | 4,200 (61.8) | 41,797.10 | 100.49 | 1 | |
| 200–<400 | 2,059 (30.2) | 2,053 (30.2) | 21,235.40 | 96.68 | 0.92 | |
| ≥400 | 543 (8.0) | 542 (8.0) | 5,665.70 | 95.66 | 0.98 (0.84–1.15) | .982 |
| Education level | ||||||
| ≤Middle school | 3,617 (53.1) | 3,603 (52.0) | 35,738.90 | 100.81 | 1 | |
| High school | 2,217 (32.5) | 2,210 (33.4) | 22,928.40 | 96.39 | 1.03 | |
| ≥College | 982 (14.4) | 982 (14.6) | 10,030.90 | 97.90 | 1.00 (0.88–1.15) | .954 |
| Sleep duration per night (hr) | ||||||
| ≤6 | 2,916 (42.8) | 2,905 (42.8) | 29,405.80 | 98.79 | 1 | |
| 7–8 | 3,422 (50.2) | 3,413 (50.4) | 34,604.50 | 98.63 | 0.94 | |
| ≥9 | 478 (7.0) | 477 (6.8) | 4,687.90 | 101.75 | 0.98 (0.83–1.15) | .793 |
| Cigarette smoking | ||||||
| Never smoker | 4,066 (59.7) | 4,050 (61.1) | 41,974.50 | 96.49 | 1 | |
| Former smoker | 1,077 (15.8) | 1,074 (15.7) | 10,753.90 | 99.87 | 1.03 | |
| Current smoker | 1,673 (24.5) | 1,671 (23.2) | 15,969.80 | 104.63 | 1.12 (0.98–1.28) | .104 |
| Alcohol consumption | ||||||
| Never drinker | 3,093 (45.4) | 3,080 (45.3) | 31,343.90 | 98.26 | 1 | |
| Former drinker | 404 (5.9) | 403 (5.9) | 4,017.60 | 100.31 | 0.92 | |
| Current drinker | 3,319 (48.7) | 3,312 (48.8) | 33,336.70 | 99.35 | 0.99 (0.90–1.09) | .848 |
| Self-reported health status | ||||||
| Poor | 2,069 (30.4) | 2,061 (29.2) | 20,055.80 | 102.76 | 1 | |
| Fair | 2,504 (36.7) | 5,495 (37.6) | 25,817.40 | 212.84 | 0.93 | |
| Good | 2,243 (32.9) | 2,239 (33.2) | 22,825.00 | 98.09 | 0.98 (0.89–1.09) | .735 |
| Family history of DM | ||||||
| No | 6,151 (90.2) | 6,132 (90.6) | 62,216.60 | 98.56 | 1 | |
| Yes | 665 (9.8) | 663 (9.4) | 6,481.60 | 102.29 | 1.42 (1.26–1.61) | <.001 |
| Chronic disease | ||||||
| No | 5,795 (85.0) | 5,776 (86.4) | 59,380.50 | 97.27 | 1 | |
| Yes | 1,021 (15.0) | 1,019 (13.6) | 9,317.70 | 109.36 | 1.53 (1.38–1.70) | <.001 |
| Moderate physical activity | ||||||
| Low | 6,294 (92.3) | 6,275 (92.1) | 63,283.20 | 99.16 | 1 | |
| High | 522 (7.7) | 520 (7.9) | 5,415.00 | 96.03 | 0.92 (0.79–1.07) | .270 |
| Severe physical activity | ||||||
| Low | 4,949 (72.6) | 4,933 (72.4) | 49,716.5 | 99.22 | 1 | |
| High | 1,867 (27.4) | 1,862 (27.6) | 18,981.70 | 98.09 | 0.98 (0.90–1.07) | .671 |
| TyG index | ||||||
| Low | 2,054 (30.1) | 2,046 (32.0) | 22,016.00 | 92.93 | 1 | |
| High | 4,762 (69.9) | 4,749 (68.0) | 46,682.20 | 101.73 | 1.54 (1.40–1.69) | <.001 |
| TyG–BMI | ||||||
| Low | 1,780 (26.1) | 1,772 (26.9) | 18,489.80 | 95.84 | 1 | |
| High | 5,036 (73.9) | 5,023 (73.1) | 50,208.40 | 100.04 | 1.45 (1.31–1.60) | <.001 |
| TyG–WC | ||||||
| Low | 2,700 (39.6) | 2,688 (41.3) | 28,389.80 | 94.68 | 1 | |
| High | 4,116 (60.4) | 4,107 (58.7) | 40,308.40 | 101.89 | 1.51 (1.38–1.64) | <.001 |
| TyG–WHtR | ||||||
| Low | 2,522 (37.0) | 2,512 (38.7) | 26,586.20 | 94.49 | 1 | |
| High | 4,294 (63.0) | 4,283 (61.3) | 42,112.00 | 101.70 | 1.53 (1.41–1.67) | <.001 |
| Classification | HR (95% CI) | p |
|---|---|---|
| TyG index (ref: low) | 1.47 (1.34–1.62) | <.001 |
| TyG–BMI (ref: low) | 1.38 (1.25–1.52) | <.001 |
| TyG–WC (ref: low) | 1.41 (1.29–1.53) | <.001 |
| TyG–WHtR (ref: low) | 1.43 (1.31–1.56) | <.001 |
| Characteristic | DM (N=6,816) |
χ2 (p) | |
|---|---|---|---|
| Yes (n=2,440) | No (n=4,376) | ||
| Gender | |||
| Men | 1,186 (36.9) | 2,026 (63.1) | 3.35 (.067) |
| Women | 1,254 (34.8) | 2,350 (65.2) | |
| Age (yr) | |||
| 40–49 | 1,200 (33.8) | 2,346 (66.2) | 18.55 (<.001) |
| 50–59 | 683 (39.9) | 1,028 (60.1) | |
| 60–69 | 557 (35.7) | 1,002 (64.3) | |
| Marital status | |||
| Unmarried | 32 (38.6) | 51 (61.4) | 0.35 (.838) |
| Married | 2,226 (35.8) | 3,990 (64.2) | |
| Others (divorced, separated, widowed) | 182 (35.2) | 335 (64.8) | |
| Occupation | |||
| Professional | 109 (36.2) | 192 (63.8) | 0.02 (.878) |
| Non-professional | 2,331 (35.8) | 4,184 (64.2) | |
| Monthly income (10,000 won) | |||
| <200 | 1,536 (36.4) | 2,678 (63.6) | 4.13 (.127) |
| 200–<400 | 701 (34.0) | 1,358 (66.0) | |
| ≥400 | 203 (37.4) | 340 (62.6) | |
| Education level | |||
| ≤Middle school | 1,280 (35.4) | 2,337 (64.6) | 0.59 (.746) |
| High school | 802 (36.2) | 1,415 (63.8) | |
| ≥College | 358 (36.5) | 624 (63.5) | |
| Self-reported health status | |||
| Unhealthy | 745 (36.0) | 1,324 (64.0) | 0.90 (.639) |
| Average | 879 (35.1) | 1,625 (64.9) | |
| Healthy | 816 (36.4) | 1,427 (63.6) | |
| Sleep duration per night (hr) | |||
| ≤6 | 1,064 (36.5) | 1,852 (63.5) | 1.35 (.508) |
| 7–8 | 1,202 (35.1) | 2,220 (64.9) | |
| ≥9 | 174 (36.4) | 304 (63.6) | |
| Family history of DM | |||
| Yes | 291 (43.8) | 374 (56.2) | 20.32 (<.001) |
| No | 2,149 (34.9) | 4,002 (65.1) | |
| Chronic disease | |||
| Yes | 1,974 (34.1) | 3,821 (65.9) | 50.63 (<.001) |
| No | 466 (45.6) | 555 (54.4) | |
| Cigarette smoking | |||
| Never smoker | 1,425 (35.0) | 2,641 (65.0) | 2.56 (.279) |
| Former smoker | 401 (37.2) | 676 (62.8) | |
| Current smoker | 614 (36.7) | 1,059 (63.3) | |
| Alcohol consumption | |||
| Never drinker | 1,092 (35.3) | 2,001 (64.7) | 0.62 (.734) |
| Former drinker | 145 (35.9) | 259 (64.1) | |
| Current drinker | 1,203 (36.2) | 2,116 (63.8) | |
| DM | Phase 1 (2003–2004) | Phase 2 (2005–2006) | Phase 3 (2007–2008) | Phase 4 (2011–2012) | Phase 5 (2013–2014) | Phase 6 (2013–2014) | Phase 7 (2015–2016) |
|---|---|---|---|---|---|---|---|
| Yes | 0 (0) | 257 (3.8) | 393 (5.8) | 449 (6.6) | 574 (8.4) | 1,021 (15.0) | 1,044 (15.3) |
| No | 6,816 (100.0) | 6,559 (96.2) | 6,423 (94.2) | 6,367 (93.4) | 6,242 (91.6) | 5,795 (85.0) | 5,772 (84.7) |
CI, confidence interval; DM, diabetes mellitus; HR, hazard ratio; TyG, triglyceride-glucose; TyG index, triglyceride-glucose index; TyG–WC, triglyceride-glucose–waist circumference; TyG–BMI, triglyceride-glucose–body mass index; TyG–WHtR, triglyceride glucose–waist-to-height ratio.
The references were TyG index (low), TyG–BMI (low), TyG–WC (low), and TyG–WHtR (low). The controlled variables were demographic, lifestyle, and health-related characteristics. CI, confidence interval; HR, hazard ratio; TyG, triglyceride-glucose; TyG–BMI, triglyceride-glucose–body mass index; TyG index, triglyceride-glucose index; TyG–WC, triglyceride-glucose–waist circumference; TyG–WHtR, triglyceride glucose–waist-to-height ratio.
Values are presented as number (%) unless otherwise stated. DM, diabetes mellitus.
Values are presented as number (%) unless otherwise stated. DM, diabetes mellitus.
 KSNS
KSNS
 E-SUBMISSION
 ePub Link
 Cite
Cite

