 Submit an article
Articles
- Page Path
- HOME > J Korean Acad Nurs > Volume 54(4); 2024 > Article
-
Research Paper
기술수용모델II에 기반한 중장년층 입원환자의 스마트모니터 기반 모바일헬스 이용 의도에 관한 경로분석 -
주옳음1
 , 하이경2
 - Factors Affecting the Intention to Use Smartmonitor-Based Mobile Health in Middle-Aged in Patients Applying the Technology Acceptance Model II
-
Ol Eum Joo1, Yi Kyung Ha2
-
Journal of Korean Academy of Nursing 2024;54(4):620-632.
DOI: https://doi.org/10.4040/jkan.24091
Published online: November 13, 2024
1부산고려병원 간호부
2동의대학교 간호학과 · 동의간호과학연구소
1Nursing Department, Busan Korea Hospital, Busan, Korea
2Department of Nursing, Research Institute of Dong-eui Nursing Science, Dong-eui University, Busan, Korea
- Address reprint requests to : Ha, Yi Kyung Department of Nursing, Dong-eui University, 176 Eomgwangno, Busanjin-gu, Busan 47340, Korea Tel: +82-51-890-4252 Fax: +82-505-182-6876 E-mail: yikyung.ha@deu.ac.kr
• Received: August 2, 2024 • Revised: September 18, 2024 • Accepted: October 21, 2024
© 2024 Korean Society of Nursing Science
This is an Open Access article distributed under the terms of the Creative Commons Attribution NoDerivs License (http://creativecommons.org/licenses/by-nd/4.0) If the original work is properly cited and retained without any modification or reproduction, it can be used and re-distributed in any format and medium.


Figure & Data
REFERENCES
Citations
Citations to this article as recorded by 
- Research on the implementation path of digital-intelligent healthcare based on the TAM model from the perspective of high-quality development
Zijue Qi, Huize Han, Yidayetula Abuduaini, Aikeda Litipu, Jun Li
BMC Health Services Research.2026;[Epub] CrossRef
 ePub Link
 Cite
CiteFactors Affecting the Intention to Use Smartmonitor-Based Mobile Health in Middle-Aged in Patients Applying the Technology Acceptance Model II
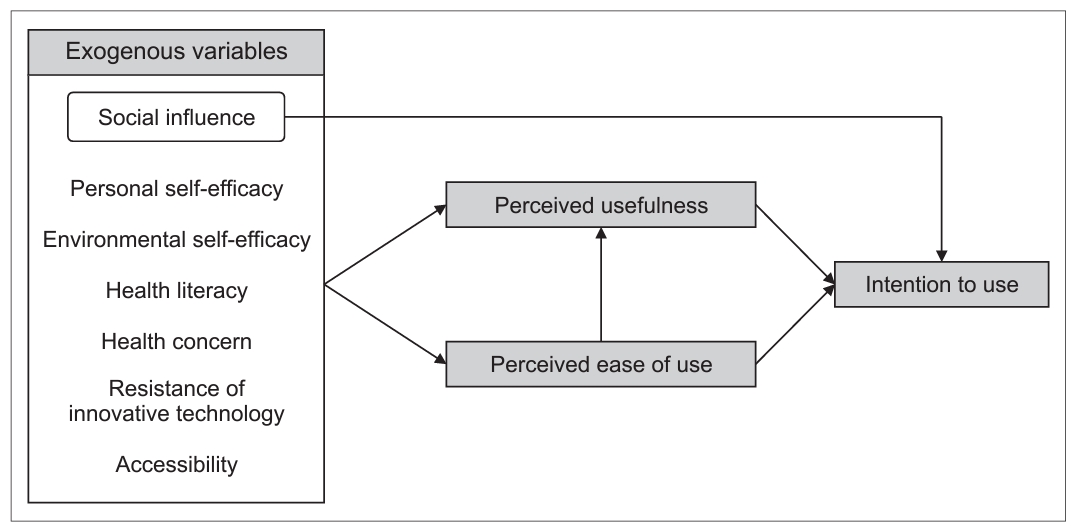
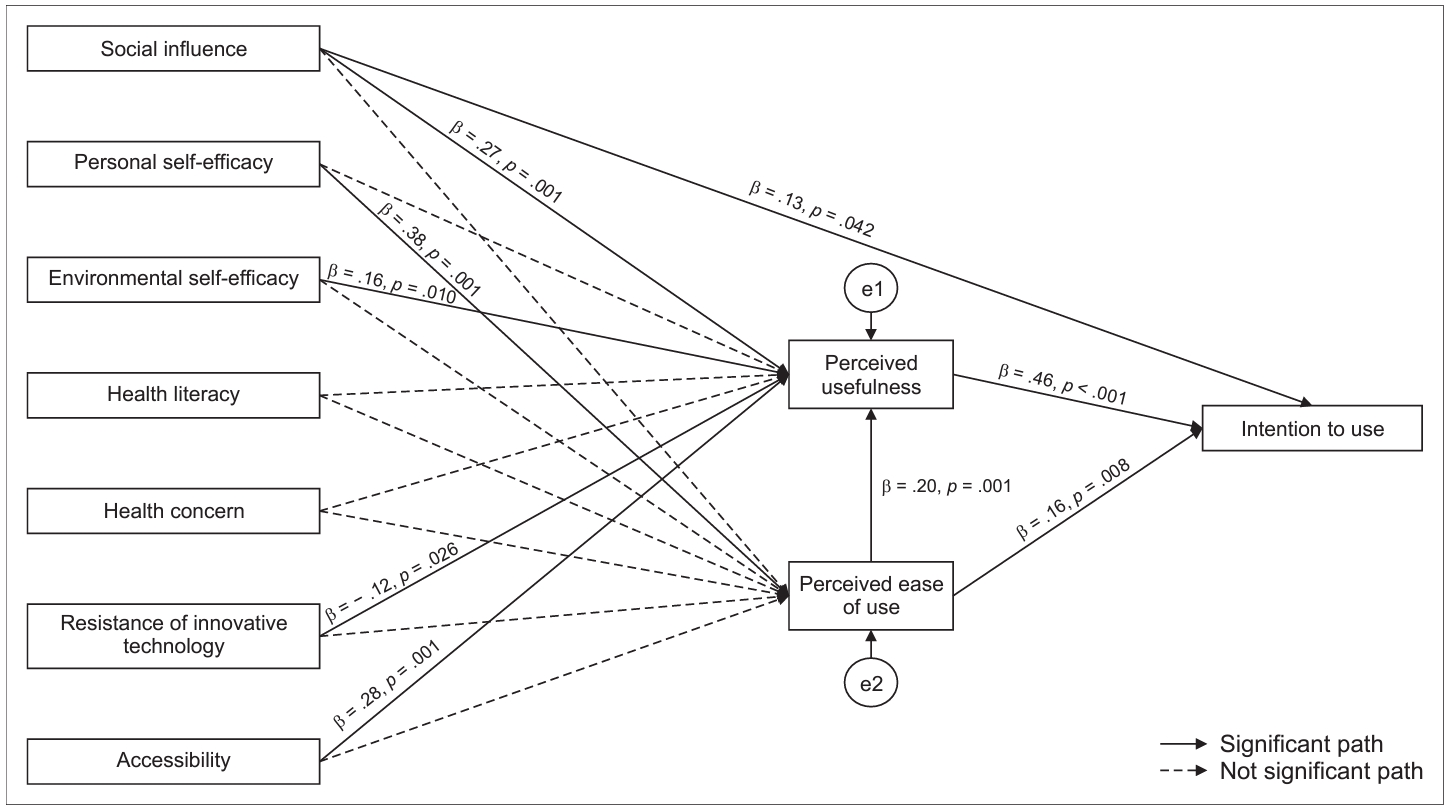
Fig. 1. Conceptual framework of this study.
Fig. 2. Path diagram for the final model.
Fig. 1.
Fig. 2.
Factors Affecting the Intention to Use Smartmonitor-Based Mobile Health in Middle-Aged in Patients Applying the Technology Acceptance Model II
| Variables | Categories | M ± SD | Intention to use |
||
|---|---|---|---|---|---|
| n (%) | M ± SD | t or F (p) | |||
| Gender | Man | 80 (36.0) | 12.16 ± 1.60 | 0.56 (.579) | |
| Woman | 142 (64.0) | 12.03 ± 1.79 | |||
| Age (yr) | 40~49a | 52.7 ± 8.17 | 88 (39.6) | 12.66 ± 1.65 | 10.84 (< .001) |
| 50~59b | 72 (32.5) | 11.94 ± 1.55 | a > c | ||
| 60~69c | 62 (27.9) | 11.40 ± 1.77 | |||
| Level of education | Middle schoola | 27 (12.2) | 11.00 ± 2.45 | 11.27 (< .001) | |
| High schoolb | 90 (40.5) | 11.83 ± 1.32 | a < c | ||
| Universityc | 105 (47.3) | 12.56 ± 1.66 | |||
| Monthly income (10,000 won) | < 100a | 27 (12.2) | 11.30 ± 2.20 | 3.57 (.030) | |
| 100~< 200b | 26 (11.7) | 11.92 ± 1.29 | a < c | ||
| ≥ 200c | 169 (76.1) | 12.22 ± 1.73 | |||
| Subjective health status | Bada | 10 (4.5) | 10.90 ± 1.85 | 3.29 (.039) | |
| Averageb | 131 (59.0) | 12.02 ± 1.57 | a < c | ||
| Goodc | 81 (36.5) | 12.32 ± 1.89 | |||
| Type of use of mobile health |
Smartmonitor | 179 (80.6) | |||
| Pedometer | 144 (64.9) | ||||
| Sleeping app | 56 (25.2) | ||||
| Diet control | 52 (23.4) | ||||
| Alarm to medication | 41 (18.5) | ||||
| Others | 37 (16.7) | ||||
| Variables | M ± SD | Range | Skewness | Kurtosis | 1 | 2 | 3 | 4 | 5 | 6 | 7 | 8 | 9 | 10 |
|---|---|---|---|---|---|---|---|---|---|---|---|---|---|---|
r (p) |
||||||||||||||
| Social influence | 11.97 ± 1.72 | 6~15 | – 0.12 | 0.42 | 1 | |||||||||
| Personal self-efficacy | 10.46 ± 2.67 | 3~15 | – 0.41 | – 0.07 | .31 (< .001) | 1 | ||||||||
| Environmental self-efficacy | 12.05 ± 1.64 | 6~15 | – 0.24 | 0.95 | .48 (< .001) | .45 (< .001) | 1 | |||||||
| Health literacy | 36.08 ± 6.52 | 15~50 | – 0.19 | 0.27 | .32 (< .001) | .58 (< .001) | .32 (< .001) | 1 | ||||||
| Health concern | 16.09 ± 2.27 | 12~20 | 0.23 | – 0.71 | .21 (.002) | .21 (.001) | .26 (< .001) | .22 (.001) | 1 | |||||
| Resistance of innovative technology | 7.19 ± 1.97 | 3~15 | 0.56 | 1.10 | – .34 (< .001) | – .19 (.005) | – .27 (< .001) | – .04 (.546) | – .10 (.122) | 1 | ||||
| Accessibility | 15.33 ± 2.41 | 4~20 | – 0.55 | 1.92 | .45 (< .001) | .42 (< .001) | .49 (< .001) | .42 (< .001) | .27 (< .001) | – .33 (< .001) | 1 | |||
| Perceived usefulness | 12.45 ± 1.71 | 7~15 | – 0.13 | – 0.01 | .56 (< .001) | .31 (< .001) | .50 (< .001) | .29 (< .001) | .27 (< .001) | – .38 (< .001) | .57 (< .001) | 1 | ||
| Perceived ease of use | 15.10 ± 2.87 | 8~20 | – 0.22 | – 0.13 | .36 (< .001) | .56 (< .001) | .40 (< .001) | .42 (< .001) | .16 (.016) | – .24 (< .001) | .42 (< .001) | .45 (< .001) | 1 | |
| Intention to use | 12.08 ± 1.73 | 6~15 | – 0.59 | 1.59 | .44 (< .001) | .39 (< .001) | .36 (< .001) | .26 (< .001) | .18 (.009) | – .27 (< .001) | .48 (< .001) | .60 (< .001) | .41 (< .001) | 1 |
| Endogenous variables | Exogenous variables | Hypothetical model |
Direct effect |
Indirect effect |
Total effect |
SMC | |||||||
|---|---|---|---|---|---|---|---|---|---|---|---|---|---|
| β | SE | CR | p | β (p) | 95% CI | β (p) | 95% CI | β (p) | 95% CI | ||||
| PU | ← | SI | .27 | .06 | 4.67 | < .001 | .27 (< .001) | .15~.39 | .27 (< .001) | .15~.39 | .51 | ||
| ← | PSE | – .10 | .04 | – 1.54 | .124 | – .10 (.124) | – .15~.02 | – .10 (.124) | – .15~.02 | ||||
| ← | ESE | .16 | .06 | 2.58 | .010 | .16 (.010) | .04~.29 | .16 (.010) | .04~.29 | ||||
| ← | HL | – .02 | .02 | – 0.24 | .809 | – .02 (.809) | – .04~.03 | – .02 (.809) | – .04~.03 | ||||
| ← | HC | .08 | .04 | 1.66 | .097 | .08 (.097) | – .01~.14 | .08 (.097) | – .01~.14 | ||||
| ← | RIT | – .12 | .05 | – 2.22 | .026 | – .12 (.026) | – .19~– .01 | – .12 (.026) | – .19~– .01 | ||||
| ← | AC | .28 | .05 | 4.52 | < .001 | .28 (< .001) | .11~.28 | .28 (< .001) | .11~.28 | ||||
| ← | PEOU | .20 | .04 | 3.27 | .001 | .20 (.001) | .05~.38 | .20 (.001) | .05~.38 | ||||
| PEOU | ← | SI | .10 | .11 | 1.56 | .118 | .10 (.118) | – .05~.25 | .10 (.118) | – .05~.25 | .38 | ||
| ← | PSE | .38 | .08 | 5.43 | < .001 | .38 (< .001) | .26~.55 | .38 (< .001) | .26~.55 | ||||
| ← | ESE | .08 | .12 | 1.18 | .237 | .08 (.237) | – .10~.38 | .08 (.237) | – .10~.38 | ||||
| ← | HL | .09 | .03 | 1.37 | .169 | .09 (.169) | – .02~.10 | .09 (.169) | – .02~.10 | ||||
| ← | HC | – .02 | .07 | – 0.39 | .695 | – .02 (.695) | – .17~.11 | – .02 (.695) | – .17~.11 | ||||
| ← | RIT | – .08 | .09 | – 1.31 | .192 | – .08 (.192) | – .28~.06 | – .08 (.192) | – .28~.06 | ||||
| ← | AC | .12 | .08 | 1.81 | .070 | .12 (.070) | – .02~.31 | .12 (.070) | – .02~.31 | ||||
| ITU | ← | SI | .13 | .06 | 2.03 | .042 | .13 (.042) | .00~.26 | .15 (.004) | .08~.24 | .28 (.013) | .13~.43 | .40 |
| ← | PU | .46 | .07 | 6.84 | < .001 | .46 (< .001) | .33~.59 | .46 (< .001) | .33~.59 | ||||
| ← | PEOU | .16 | .04 | 2.64 | .008 | .16 (.008) | .02~.16 | .09 (.400) | .04~.17 | .25 (.009) | .11~.40 | ||
Table 1. Differences in Intentions to Use according to the General Characteristics of Participants (N=222)
M = Mean; SD = Standard deviation. Multiple response.
Table 2. Level of Study Variables and Correlations of Related Variables (N = 222)
M = Mean; SD = Standard deviation.
Table 3. Total Direct, and Indirect Effect of the Hypothetical Model (N = 222)
AC = Accessibility; CI = Confidence interval; CR = Critical ratio; ESE = Environmental self-efficacy; HC = Health concern; HL = Health literacy; ITU = Intention to use; PEOU = Perceived ease of use; PSE = Personal self-efficacy; PU = Perceived usefulness; RIT = Resistance of innovative technology; SE = Standard error; SI = Social influence; SMC = Squared multiple correlation.

