 Submit an article
Articles
- Page Path
- HOME > J Korean Acad Nurs > Volume 55(1); 2025 > Article
-
Research Paper
- Factors influencing smartphone overdependence in university students: an ecological model: a descriptive study
-
Jeong Soon Yu1
 , Myung Soon Kwon2
 -
Journal of Korean Academy of Nursing 2025;55(1):64-80.
DOI: https://doi.org/10.4040/jkan.24092
Published online: February 20, 2025
1Department of Education & Research, Global Korean Nursing Foundation, Seoul, Korea
2Research Institute of Nursing Science, School of Nursing, Hallym University, Chuncheon, Korea
- Corresponding author: Myung Soon Kwon Research Institute of Nursing Science, School of Nursing, Hallym University, 1 Hallimdaehak-gil, Chuncheon 24252, Korea E-mail: kwon1314@hallym.ac.kr
• Received: August 2, 2024 • Revised: October 2, 2024 • Accepted: December 17, 2024
© 2025 Korean Society of Nursing Science
This is an Open Access article distributed under the terms of the Creative Commons Attribution NoDerivs License (http://creativecommons.org/licenses/by-nd/4.0) If the original work is properly cited and retained without any modification or reproduction, it can be used and re-distributed in any format and medium.
Abstract
-
Purpose
- This study investigated the factors influencing smartphone overdependence in university students using an ecological model and descriptive research.
-
Methods
- Data were collected from 482 students at 13 universities in the six regions in South Korea from October 20, 2020, to March 25, 2021. Data analysis involved descriptive statistics, the chi-square test, the independent samples t-test, analysis of variance, and hierarchical multiple regression.
-
Results
- The significant ecological factors influencing smartphone overdependence included self-awareness of smartphone overdependence (β=.33, p<.001), autonomy (β=–.25, p<.001), average daily smartphone usage time (β=.18, p<.001), gender (β=.15, p=.001), college year (β=.15, p=.020), forming relationships with others as a motivation for smartphone use (β=–.15, p=.008), friend support (β=.14, p=.006), and age (β=–.12, p=.047). The model explained 34.9% of the variance.
-
Conclusion
- The study emphasized the role of personal and interpersonal factors, in smartphone overdependence among university students. Tailored intervention strategies are necessary to address smartphone overdependence, considering the unique characteristics of students’ environments. A significant aspect of this study is that it provides an explanation of the multidimensional factors contributing to smartphone overdependence among university students, including intrapersonal, interpersonal, and environmental influences.
Introduction
Methods
1) Smartphone overdependence
2) Intrapersonal factors
(1) Demographic and sociological characteristics
(2) Smartphone usage behavior
(3) Self-determination
3) Interpersonal factors
(1) Social support
(2) Family life satisfaction
4) Institutional and community factors
(1) Perceived university environment
(2) Experience in receiving education on smartphone overdependence prevention
(3) College life satisfaction
(4) City size of residence
(5) COVID-19 incidence rate
Results
1) Intrapersonal factors
(1) Demographic characteristics and smartphone usage behavior
(2) Self-determination
2) Interpersonal factors
3) Institutional and community factors
Discussion
Conclusion
-
Conflicts of Interest
No potential conflict of interest relevant to this article was reported.
-
Acknowledgements
None.
-
Funding
This study was supported by the Hallym University Research Fund, 2022 (HRF-202203-002).
-
Data Sharing Statement
Please contact the corresponding author for data availability.
-
Author Contributions
Conceptualization or/and Methodology: JSY, MSK. Data curation or/and Analysis: JSY. Funding acquisition: MSK. Investigation: JSY. Project administration or/and Supervision: MSK. Resources or/and Software: JSY. Validation: JSY, MSK. Visualization: JSY. Writing: original draft or/and review & editing: JSY, MSK. Final approval of the manuscript: JSY, MSK.
Article Information
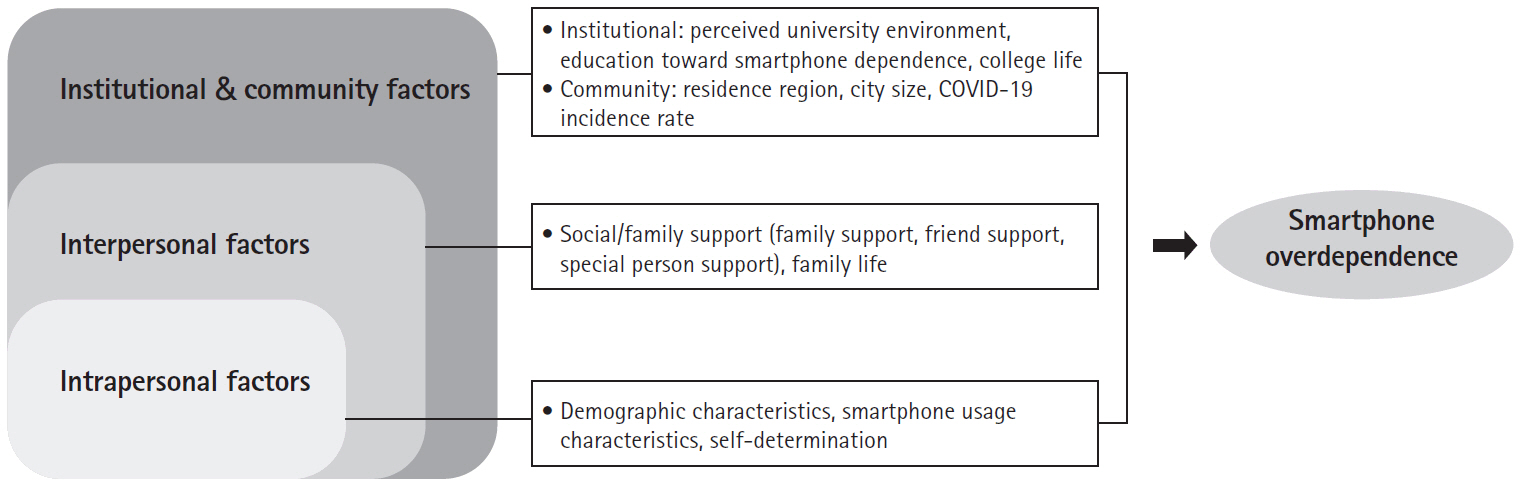
Table 1.Ecological characteristics of participants (n=482)
| Factor | Variable | Value |
|---|---|---|
| Intrapersonal | Demographic characteristics | |
| Gender | ||
| Men | 187 (38.8) | |
| Women | 295 (61.2) | |
| Age (yr) | 21.3±1.96 (18–29) | |
| College year | ||
| First year | 150 (31.1) | |
| Second year | 130 (27.0) | |
| Third year | 111 (23.0) | |
| Fourth year | 91 (18.9) | |
| Major department | ||
| Humanities | 69 (14.3) | |
| Social sciences | 85 (17.6) | |
| Education | 53 (11.0) | |
| Engineering & technology | 122 (25.3) | |
| Natural sciences | 40 (8.3) | |
| Nursing/health science | 69 (14.3) | |
| Art & physical | 44 (9.2) | |
| Residence type | ||
| Family home | 196 (40.7) | |
| Commute to college from other areas | 60 (12.4) | |
| Living outside of home | 121 (25.1) | |
| School dormitory | 105 (21.8) | |
| Cohabitation status | ||
| Parents (include family) | 256 (53.1) | |
| Friend or colleague | 103 (21.4) | |
| Alone | 123 (25.5) | |
| Smartphone usage behaviors | ||
| Smartphone overdependencea) | 37.63±8.62 (10–60) | |
| High risk user | 376 (77.8) | |
| General user | 107 (22.2) | |
| Age at first smartphone use | ||
| Elementary school | 158 (32.8) | |
| Middle school | 229 (47.5) | |
| High school | 63 (13.1) | |
| University | 32 (6.6) | |
| Motivation for smartphone use | ||
| Latest trends | 66 (13.7) | |
| Information searching | 90 (18.7) | |
| Studying purposes | 25 (5.2) | |
| Forming relationships with others | 301 (62.4) | |
| Main usage of smartphone | ||
| Phone function (voice call, message, etc.) | 14 (2.9) | |
| Entertainment functionb) | 67 (13.9) | |
| Information searching | 47 (9.7) | |
| SNS (KakaoTalk, Line, etc.) | 236 (49.0) | |
| Watching videos | 118 (24.5) | |
| Average smartphone usage time per day (hr) | 5.60±2.69 (0.75–16.00) | |
| During week average usage time (hr) | 5.22±2.75 (0.65–17.00) | |
| Weekend average usage time (hr) | 5.98±2.94 (0.50–16.00) | |
| Self-awareness of smartphone overdependence | ||
| Yes | 224 (46.5) | |
| No | 258 (53.5) | |
| Smartphone usage time after the COVID-19 (hr) | ||
| ≤1 | 147 (30.5) | |
| 2 | 114 (23.6) | |
| 3 | 119 (24.7) | |
| ≥4 | 102 (21.2) | |
| Satisfaction of smartphone usage for specific purposesc) | ||
| Information searching | 371 (77.0) | |
| Networking through SNS | 250 (51.9) | |
| Entertainment functionb) | 161 (33.4) | |
| Financial benefits | 42 (8.7) | |
| Use for learning | 36 (7.5) | |
| Problematic smartphone usec) | ||
| Conflict with parents/family | 56 (11.6) | |
| Difficulties in interpersonal relationships | 58 (12.0) | |
| Excessive usage charges | 65 (13.5) | |
| Decreased health status | 196 (40.7) | |
| Decreased academic and work efficiency | 303 (62.9) | |
| Others | 28 (5.8) | |
| Health status related to smartphone usec) | ||
| Lack of sleep | 155 (32.2) | |
| Impaired vision and dry eye | 224 (46.5) | |
| Headache | 50 (10.4) | |
| Decreased concentration | 191 (39.6) | |
| Decreased physical strength | 35 (7.3) | |
| Musculoskeletal pain (neck, back, wrist, etc.) | 121 (25.1) | |
| Self-determination | 82.61±10.85 (39–108) | |
| Autonomy | 27.42±4.99 (10–36) | |
| Competence | 26.05±4.73 (10–36) | |
| Relatedness | 29.14±4.13 (16–36) | |
| Interpersonal | Social support | 48.70±7.64 (22–60) |
| Family support | 16.20±3.16 (4–20) | |
| Friend support | 16.22±2.93 (4–20) | |
| Significant other support | 16.29±2.96 (4–20) | |
| Family life satisfaction | 4.09±0.86 (1–5) | |
| Satisfied | 376 (78.0) | |
| Unsatisfied | 106 (22.0) | |
| Institutional & community | Perceived university environment | 2.62±0.78 (1–5) |
| Experience of receiving education on smartphone overdependence prevention | ||
| Yes | 115 (23.9) | |
| No | 367 (76.1) | |
| College life satisfaction | 3.54±0.88 (1–5) | |
| Satisfied | 264 (54.8) | |
| Unsatisfied | 218 (45.2) | |
| City size of residenced) | ||
| Metropolitan city | 347 (72.0) | |
| Small-medium size city | 135 (28.0) | |
| COVID-19 incidence ratee) | 109.19±73.36 (9.67–271.91) |
Values are presented as number (%) or mean±standard deviation (range).
COVID-19, coronavirus disease 2019; SNS, social network service.
a)Smartphone overdependence criteria: Men: ≥31, Women: ≥33. b)Game, hobby, music, movie, etc. c)Multiple response. d)City size classification criteria: large metropolitan area, 1 million or more; metropolitan area, 500,000 or more and less than 1 million; small-medium size area, less than 500,000 according to population data from the National Environment Information Network System (https://www.neins.go.kr/mid=11010200). e)Based on COVID-19 incidence rate: 139.13/100,000 population on period from October 1, 2020 to March 25, 2021; http://ncov.mohw.go.kr/; Population Source by Region-Ministry of the Interior and Safety, Resident Registered Population Status (based on January 2020).
Table 2.Degree of smartphone overdependence according to ecological factors (n=482)
| Factor | Variable |
Smartphone overdependence |
|
|---|---|---|---|
| Mean±SD | t or F (p) | ||
| Intrapersonal | Demographic characteristics | ||
| Gender | –6.70 (<.001) | ||
| Men | 34.47±8.83 | ||
| Women | 39.64±7.87 | ||
| College year | 1.93 (.124) | ||
| First year | 37.29±8.23 | ||
| Second year | 36.69±8.30 | ||
| Third year | 37.72±9.01 | ||
| Fourth year | 39.43±9.09 | ||
| Major department | 1.01 (.416) | ||
| Humanities | 39.01±9.13 | ||
| Social sciences | 37.52±8.06 | ||
| Education | 38.30±8.55 | ||
| Engineering & technology | 36.24±9.06 | ||
| Natural sciences | 37.13±8.05 | ||
| Nursing/health science | 38.42±8.38 | ||
| Art & physical | 37.95±8.63 | ||
| Residence type | 0.60 (.615) | ||
| Family home | 37.96±9.19 | ||
| Commute to college in other areas | 37.65±8.31 | ||
| Living outside of home | 37.94±7.83 | ||
| School dormitory | 36.65±8.63 | ||
| Cohabitation status | 0.41 (.667) | ||
| Parents (include family) | 37.89±8.97 | ||
| Friend or colleague | 36.98±8.92 | ||
| Alone | 37.64±7.60 | ||
| Smartphone usage behaviors | |||
| Age at first smartphone use | 0.61 (.611) | ||
| Elementary school | 37.81±7.99 | ||
| Middle school | 37.83±8.97 | ||
| High school | 36.27±8.93 | ||
| University | 38.03±8.63 | ||
| Motivation for smartphone use | 2.43 (.064) | ||
| Latest trends | 39.71±9.48 | ||
| Information searching | 37.97±8.33 | ||
| Studying purposes | 34.72±7.69 | ||
| Forming relationships with others | 37.32±8.53 | ||
| Main usage of smartphone | 1.00 (.406) | ||
| Phone function (voice call, message, etc.) | 35.93±8.49 | ||
| Entertainment functiona) | 36.21±9.39 | ||
| Information searching | 36.98±8.77 | ||
| SNS (KakaoTalk, Line, etc.) | 38.29±8.41 | ||
| Watching video | 37.58±8.56 | ||
| Self-awareness of smartphone overdependence | –11.47 (<.001) | ||
| Yes | 41.92±7.08 | ||
| No | 33.91±8.11 | ||
| Smartphone usage time after the COVID-19 (hr) | 11.39 (<.001) a,b,c<d | ||
| ≤1a | 35.91±9.30 | ||
| 2b | 35.96±8.40 | ||
| 3c | 38.05±7.69 | ||
| ≥4d | 41.64±7.60 | ||
| Interpersonal | Family life satisfaction | 2.24 (.025) | |
| Satisfied | 37.16±8.52 | ||
| Unsatisfied | 39.28±8.82 | ||
| Institutional & community | Experience of receiving education on smartphone overdependence prevention | –0.15 (.877) | |
| Yes | 37.74±8.45 | ||
| No | 37.60±8.68 | ||
| College life satisfaction | 2.43 (.016) | ||
| Satisfied | 36.77±8.61 | ||
| Unsatisfied | 38.67±8.54 | ||
| City size of residenceb) | 0.86 (.390) | ||
| Metropolitan city | 37.84±8.56 | ||
| Small-medium size city | 37.09±8.80 | ||
COVID-19, coronavirus disease 2019; SD, standard deviation; SNS, social network service.
a)Game, hobby, music, movie, etc. b)City size classification criteria: large metropolitan area, 1 million or more; metropolitan area, 500,000 or more and less than 1 million; small-medium size area, less than 500,000 according to population data from the National Environment Information Network System (https://www.neins.go.kr/mid=11010200).
Table 3.Correlation between smartphone overdependence and ecological factors (n=482)
x1, smartphone overdependence; x2, age; x3, average smartphone usage time per day (hr); x4, autonomy; x5, competence; x6, relatedness; x7, family support; x8, friend support; x9, significant other support; x10, perceived university environment; x11, COVID-19 incidence rate (from October 1, 2020 to March 25, 2021).
COVID-19, coronavirus disease 2019.
Table 4.Factor influencing smartphone overdependence of university students (n=482)
| Level | Variable |
Model I |
Model II |
Model III |
||||||
|---|---|---|---|---|---|---|---|---|---|---|
| β | SE | t (p) | β | SE | t (p) | β | SE | t (p) | ||
| Intrapersonal | (constants) | - | 6.09 | 8.72 (<.001) | - | 6.36 | 7.92 (<.001) | - | 7.00 | 6.87 (<.001) |
| Gendera) | ||||||||||
| Women | .15 | 0.77 | 3.35 (<.001) | .15 | 0.77 | 3.55 (<.001) | .15 | 0.78 | 3.43 (.001) | |
| Age | –.14 | 0.26 | –2.27 (.024) | –.13 | 0.26 | –2.14 (.033) | –.12 | 0.27 | –1.99 (.047) | |
| College yeara) | ||||||||||
| Second year | .01 | 0.89 | 0.27 (.790) | .00 | 0.89 | 0.09 (.931) | .01 | 0.90 | 0.13 (.898) | |
| Third year | .10 | 1.12 | 1.83 (.067) | .10 | 1.19 | 1.77 (.077) | .10 | 1.12 | 1.78 (.076) | |
| Fourth year | .16 | 1.36 | 2.54 (.011) | .15 | 1.36 | 2.39 (.017) | .15 | 1.37 | 2.33 (.020) | |
| Average smartphone usage time per day | .20 | 0.13 | 4.96 (<.001) | .18 | 0.13 | 4.65 (<.001) | .18 | 0.13 | 4.58 (<.001) | |
| Motivation for smartphone usea) | ||||||||||
| Information searching | –.10 | 1.14 | –1.97 (.049) | –.08 | 1.15 | –1.57 (.118) | –.08 | 1.16 | –1.46 (.144) | |
| Studying purposes | –.09 | 1.66 | –2.10 (.036) | –.08 | 1.66 | –1.90 (.059) | –.08 | 1.67 | –1.91 (.057) | |
| Forming relationships with others | –.16 | 0.97 | –2.93 (.004) | –.15 | 0.97 | –2.77 (.006) | –.15 | 0.97 | –2.66 (.008) | |
| Self-awareness of smartphone overdependence: yesa) | .33 | 0.70 | 8.18 (<.001) | .33 | 0.70 | 8.11 (<.001) | .33 | 0.71 | 8.06 (<.001) | |
| Self-determination | ||||||||||
| Autonomy | –.23 | 0.07 | –5.57 (<.001) | –.25 | 0.07 | –5.82 (<.001) | –.25 | 0.08 | –5.79 (<.001) | |
| Competence | .03 | 0.08 | 0.80 (.425) | .02 | 0.08 | 0.48 (.630) | .02 | 0.08 | 0.41 (.681) | |
| Interpersonal | Social support | |||||||||
| Family support | .03 | 0.14 | 0.47 (.640) | .03 | 0.15 | 0.57 (.569) | ||||
| Friend support | .14 | 0.15 | 2.78 (.006) | .14 | 0.15 | 2.78 (.006) | ||||
| Special person support | –.07 | 0.15 | –1.27 (.203) | –.07 | 0.16 | –1.37 (.173) | ||||
| Satisfaction with family life: satisfieda) | –.07 | 0.93 | –1.49 (.138) | –.07 | 0.95 | –1.53 (.127) | ||||
| Institutional & community | Perceived university environment | –.00 | 0.44 | –0.09 (.925) | ||||||
| Satisfaction of college life: satisfieda) | .02 | 0.71 | 0.36 (.718) | |||||||
| City size of residence: small-medium size citya,b) | –.02 | -0.75 | –0.42 (.677) | |||||||
| COVID-19 incidence ratec) | .04 | 0.46 | 1.03 (.302) | |||||||
| R2 (adjusted R2) | .36 (.345) | .37 (.353) | .38 (.349) | |||||||
| △R2 | .36 | .01 | .00 | |||||||
| F (p) | 22.07 (<.001) | 17.38 (<.001) | 13.92 (<.001) | |||||||
| △F (p) | 22.07 (<.001) | 2.47 (.044) | 0.42 (.796) | |||||||
COVID-19, coronavirus disease 2019; SE, standard error.
a)Reference of dummy variables: gender, Men; college year, first year; motivation for smartphone use, latest trend; self-awareness of smartphone overdependence, no; satisfaction with family life, unsatisfied; satisfaction of college life, unsatisfied; city size of residence, metropolitan city. b)City size classification criteria: large metropolitan area, 1 million or more; metropolitan area, 500,000 or more and less than 1 million; small-medium size area, less than 500,000 according to population data from the National Environment Information Network System (https://www.neins.go.kr/mid=11010200). c)Based on COVID-19 incidence rate: 139.13/100,000 population on period from 2020 October 1 to 2021 March 25; http://ncov.mohw.go.kr/; Population Source by Region-Ministry of the Interior and Safety, Resident Registered Population Status (based on January 2020).
- 1. David ME, Roberts JA. Smartphone use during the COVID-19 pandemic: social versus physical distancing. Int J Environ Res Public Health. 2021;18(3):1034. https://doi.org/10.3390/ijerph18031034ArticlePubMedPMC
- 2. Olson JA, Sandra DA, Chmoulevitch D, Raz A, Veissière SP. A nudge-based intervention to reduce problematic smartphone use: randomised controlled trial. Int J Ment Health Addict. 2023;21:3842-3864. https://doi.org/10.1007/s11469-022-00826-wArticle
- 3. Van Deursen AJ, Bolle CL, Hegner SM, Kommers PA. Modeling habitual and addictive smartphone behavior: the role of smartphone usage types, emotional intelligence, social stress, self-regulation, age, and gender. Comput Hum Behav. 2015;45:411-420. https://doi.org/10.1016/j.chb.2014.12.039Article
- 4. Duke É, Montag C. Smartphone addiction, daily interruptions and self-reported productivity. Addict Behav Rep. 2017;6:90-95. https://doi.org/10.1016/j.abrep.2017.07.002ArticlePubMedPMC
- 5. Samaha M, Hawi NS. Relationships among smartphone addiction, stress, academic performance, and satisfaction with life. Comput Hum Behav. 2016;57:321-325. https://doi.org/10.1016/j.chb.2015.12.045Article
- 6. Mustafaoglu R, Yasaci Z, Zirek E, Griffiths MD, Ozdincler AR. The relationship between smartphone addiction and musculoskeletal pain prevalence among young population: a cross-sectional study. Korean J Pain. 2021;34(1):72-81. https://doi.org/10.3344/kjp.2021.34.1.72ArticlePubMedPMC
- 7. Elhai JD, Tiamiyu M, Weeks J. Depression and social anxiety in relation to problematic smartphone use: the prominent role of rumination. Internet Res. 2018;28(2):315-332. https://doi.org/10.1108/IntR-01-2017-0019Article
- 8. Kim E, Koh E. Avoidant attachment and smartphone addiction in college students: the mediating effects of anxiety and self-esteem. Comput Hum Behav. 2018;84:264-271. https://doi.org/10.1016/j.chb.2018.02.037Article
- 9. National Information Society Agency. 2016 Digital culture forum policy research report. National Information Society Agency; 2016. Report No.: NIA V-RER-B-16007.
- 10. Shen X, Wang JL. Loneliness and excessive smartphone use among Chinese college students: moderated mediation effect of perceived stressed and motivation. Comput Hum Behav. 2019;95:31-36. https://doi.org/10.1016/j.chb.2019.01.012Article
- 11. Ching SM, Yee A, Ramachandran V, Sazlly Lim SM, Wan Sulaiman WA, Foo YL, et al. Validation of a Malay version of the Smartphone Addiction Scale among medical students in Malaysia. PLoS One. 2015;10(10):e0139337. https://doi.org/10.1371/journal.pone.0139337ArticlePubMedPMC
- 12. National Information Society Agency. The 2015 survey on internet overdependence [Internet]. National Information Society Agency; 2016 [cited 2023 Jul 20]. Available from: https://www.nia.or.kr/site/nia_kor/ex/bbs/View.do?cbIdx=65914&bcIdx=17132&parentSeq=17132
- 13. Shin SM, Koh YS, Song YS, Oh JS, Park MJ. Delphi analysis on the use of the term ‘Internet addiction’ and development of an alternate term. Korean J Addict Psychol. 2017;2(2):15-29. https://doi.org/10.23147/ADDICTPSY.PUB.2.2.15Article
- 14. National Information Society Agency. The 2023 survey on smart phone overdependence [Internet]. National Information Society Agency; 2023 [cited 2023 Jul 20]. Available from: https://www.nia.or.kr/site/nia_kor/ex/bbs/View.do?cbIdx=65914&bcIdx=26508&parentSeq=26508
- 15. Kwon MS, Jin J. Exploring the basic psychological needs necessary for the internalized motivation of university students with smartphone overdependence: applying a self-determination theory. J Korean Acad Psychiatr Ment Health Nurs. 2019;28(1):26-36. https://doi.org/10.12934/jkpmhn.2019.28.1.26Article
- 16. Elhai JD, Yang H, McKay D, Asmundson GJ. COVID-19 anxiety symptoms associated with problematic smartphone use severity in Chinese adults. J Affect Disord. 2020;274:576-582. https://doi.org/10.1016/j.jad.2020.05.080ArticlePubMedPMC
- 17. McLeroy KR, Bibeau D, Steckler A, Glanz K. An ecological perspective on health promotion programs. Health Educ Q. 1988;15(4):351-377. https://doi.org/10.1177/109019818801500401ArticlePubMed
- 18. Billieux J, Van der Linden M, d’Acremont M, Ceschi G, Zermatten A. Does impulsivity relate to perceived dependence on and actual use of the mobile phone? Appl Cogn Psychol. 2007;21(4):527-537. https://doi.org/10.1002/acp.1289Article
- 19. Celikkalp U, Bilgic S, Temel M, Varol G. The smartphone addiction levels and the association with communication skills in nursing and medical school students. J Nurs Res. 2020;28(3):e93. https://doi.org/10.1097/jnr.0000000000000370ArticlePubMed
- 20. Choo YK, Bae WS. Comparative impact analysis of attention control and interpersonal support according to the degree of smartphone addiction of health-related college students. J Korean Soc Integr Med. 2021;9(2):183-192. https://doi.org/10.15268/ksim.2021.9.2.183Article
- 21. Roberts JA, Yaya LH, Manolis C. The invisible addiction: cell-phone activities and addiction among male and female college students. J Behav Addict. 2014;3(4):254-265. https://doi.org/10.1556/JBA.3.2014.015ArticlePubMedPMC
- 22. De-Sola Gutiérrez J, Rodríguez de Fonseca F, Rubio G. Cell-phone addiction: a review. Front Psychiatry. 2016;7:175. https://doi.org/10.3389/fpsyt.2016.00175ArticlePubMedPMC
- 23. Robayo-Pinzon O, Foxall GR, Montoya-Restrepo LA, Rojas-Berrio S. Does excessive use of smartphones and apps make us more impulsive?: an approach from behavioural economics. Heliyon. 2021;7(2):e06104. https://doi.org/10.1016/j.heliyon.2021.e06104ArticlePubMedPMC
- 24. Deci EL, Ryan RM. The “what” and “why” of goal pursuits: human needs and the self-determination of behavior. Psychol Inq. 2000;11(4):227-268. https://doi.org/10.1207/S15327965PLI1104_01Article
- 25. Kwon MS, Yu JS. Development and effect of a smartphone overdependence prevention program for university students based on self-determination theory. J Korean Acad Nurs. 2020;50(1):116-131. https://doi.org/10.4040/jkan.2020.50.1.116ArticlePubMed
- 26. Cohen S, Hoberman HM. Positive events and social supports as buffers of life change stress. J Appl Soc Psychol. 1983;13(2):99-125. https://doi.org/10.1111/j.1559-1816.1983.tb02325.xArticle
- 27. Mazzoni E, Baiocco L, Cannata D, Dimas I. Is internet the cherry on top or a crutch?: offline social support as moderator of the outcomes of online social support on problematic internet use. Comput Hum Behav. 2016;56:369-374. https://doi.org/10.1016/j.chb.2015.11.032Article
- 28. Ko M, Yang S, Lee J, Heizmann C, Jeong J, Lee U, et al. NUGU: a group-based intervention app for improving self-regulation of limiting smartphone use. Proceedings of the 18th ACM Conference on Computer Supported Cooperative Work & Social Computing; 2015 Mar 14-18; Vancouver, Canada. Association for Computing Machinery; 2015. p. 1235-1245. https://doi.org/10.1145/2675133.2675244Article
- 29. Kwon MS, Lee BY. Relationship among basic psychological needs, smartphone addiction and adaptation to school life in university students. J Korean Public Health Nurs. 2017;31(3):540-553. https://doi.org/10.5932/JKPHN.2017.31.3.540Article
- 30. National Information Society Agency. The 2012 survey on internet addiction [Internet]. National Information Society Agency; 2012 [cited 2023 Jul 20]. Available from: https://www.nia.or.kr/site/nia_kor/ex/bbs/View.do?cbIdx=65914&bcIdx=11067&parentSeq=11067
- 31. Yu JD, Lee IS, Yang JH. A study on regional smart-phone addiction with demographic and sociodemographic factors. J Soc Sci. 2014;40(3):51-75. https://doi.org/10.15820/khjss.2014.40.3.003Article
- 32. Halinski RS, Feldt LS. The selection of variables in multiple regression analysis. J Educ Meas. 1970;7(3):151-157. https://doi.org/10.1111/j.1745-3984.1970.tb00709.xArticle
- 33. Kwon M, Kim DJ, Cho H, Yang S. The smartphone addiction scale: development and validation of a short version for adolescents. PLoS One. 2013;8(12):e83558. https://doi.org/10.1371/journal.pone.0083558ArticlePubMedPMC
- 34. Lee MH, Kim A. Development and construct validation of the basic psychological needs scale for Korean adolescents:based on the self-determination theory. Korean J Soc Personal Psychol. 2008;22(4):157-174. https://doi.org/10.21193/kjspp.2008.22.4.010Article
- 35. Zimet GD, Dahlem NW, Zimet SG, Farley GK. The multidimensional scale of perceived social support. J Pers Assess. 1988;52(1):30-41. https://doi.org/10.1207/s15327752jpa5201_2Article
- 36. Shin JS, Lee YB. The effects of social supports on psychosocial well-being of the unemployed. Korean J Soc Welf [Internet]. 1999 [cited 2024 Dec 10];37:241-269. Available from: https://koreascience.kr/article/JAKO199903749521496.pdf
- 37. Heo MJ. Physical activity of college students based on ecological model [master’s thesis]. Seoul: Ewha Womens University; 2014 [cited 2024 Jun 10]. Available from: https://dspace.ewha.ac.kr/handle/2015.oak/211645
- 38. Kamphuis CB, van Lenthe FJ, Giskes K, Brug J, Mackenbach JP. Perceived environmental determinants of physical activity and fruit and vegetable consumption among high and low socioeconomic groups in the Netherlands. Health Place. 2007;13(2):493-503. https://doi.org/10.1016/j.healthplace.2006.05.008ArticlePubMed
- 39. National Environment Information Network System. Understanding the national environment: cities in Korea [Internet]. National Environment Information Network System; 2021 [cited 2024 Jun 10]. Available from: https://www.neins.go.kr/mid=11010200
- 40. Ministry of Health and Welfare. Current status of COVID-19 domestic outbreaks in Korea (as of October 1, 2020) (No. 17337) [Internet]. Ministry of Health and Welfare; 2021 [cited 2024 Jun 10]. Available from: https://www.mohw.go.kr/board.es?mid=a10503010100&bid=0027&cg_code=
- 41. Ministry of Health and Welfare. COVID-19 outbreak and vaccination status in Korea (as of March 25, 2021) (No. 18192) [Internet]. Ministry of Health and Welfare; 2021 [cited 2024 Jun 10]. Available from: https://www.mohw.go.kr/board.es?mid=a10503010100&bid=0027&cg_code=
- 42. Carbonell X, Chamarro A, Oberst U, Rodrigo B, Prades M. Problematic use of the Internet and smartphones in university students: 2006-2017. Int J Environ Res Public Health. 2018;15(3):475. https://doi.org/10.3390/ijerph15030475ArticlePubMedPMC
- 43. Launiala A. How much can a KAP survey tell us about people’s knowledge, attitudes and practices?: some observations from medical anthropology research on malaria in pregnancy in Malawi. Anthropol Matters. 2009;11(1):1-13. https://doi.org/10.22582/am.v11i1.31Article
- 44. Hong K, Jeon H. The relationship between college students’ SNS addiction tendency and their interpersonal problems: focused on the moderating effect of social support. Health Soc Welf Rev. 2017;37(1):34-67. https://doi.org/10.15709/hswr.2017.37.1.34Article
- 45. Lee SJ, Rhee MK. Effect of personalities and use motivations of smartphone users on smartphone addiction. Korean J Health Psychol. 2016;21(2):357-372. https://doi.org/10.17315/KJHP.2016.21.2.004Article
- 46. Felsman DE, Blustein DL. The role of peer relatedness in late adolescent career development. J Vocat Behav. 1999;54(2):279-295. https://doi.org/10.1006/jvbe.1998.1664Article
- 47. Jin L, Hao Z, Huang J, Akram HR, Saeed MF, Ma H. Depression and anxiety symptoms are associated with problematic smartphone use under the COVID-19 epidemic: the mediation models. Child Youth Serv Rev. 2021;121:105875. https://doi.org/10.1016/j.childyouth.2020.105875ArticlePubMedPMC
- 48. Seo M, Kim JH, David P. Always connected or always distracted? ADHD symptoms and social assurance explain problematic use of mobile phone and multicommunicating. J Comput Mediat Commun. 2015;20(6):667-681. https://doi.org/10.1111/jcc4.12140Article
- 49. Son YJ, Heo MS. A study on social media usage, helplessness, and loneliness experienced by college students since the COVID-19 pandemic. J Digit Contents Soc. 2020;21(11):1957-1971. https://doi.org/10.9728/dcs.2020.21.11.1957Article
References
Figure & Data
REFERENCES
Citations
Citations to this article as recorded by 
- Research on the application behavior of generative artificial intelligence learning of college students based on self-determination theory
Xu Fang, Junci Feng
Frontiers in Psychology.2026;[Epub] CrossRef
 ePub Link
 Cite
CiteFactors influencing smartphone overdependence in university students: an ecological model: a descriptive study

Figure 1. Study framework. COVID-19, coronavirus disease 2019.
Figure 1.
Factors influencing smartphone overdependence in university students: an ecological model: a descriptive study
| Factor | Variable | Value |
|---|---|---|
| Intrapersonal | Demographic characteristics | |
| Gender | ||
| Men | 187 (38.8) | |
| Women | 295 (61.2) | |
| Age (yr) | 21.3±1.96 (18–29) | |
| College year | ||
| First year | 150 (31.1) | |
| Second year | 130 (27.0) | |
| Third year | 111 (23.0) | |
| Fourth year | 91 (18.9) | |
| Major department | ||
| Humanities | 69 (14.3) | |
| Social sciences | 85 (17.6) | |
| Education | 53 (11.0) | |
| Engineering & technology | 122 (25.3) | |
| Natural sciences | 40 (8.3) | |
| Nursing/health science | 69 (14.3) | |
| Art & physical | 44 (9.2) | |
| Residence type | ||
| Family home | 196 (40.7) | |
| Commute to college from other areas | 60 (12.4) | |
| Living outside of home | 121 (25.1) | |
| School dormitory | 105 (21.8) | |
| Cohabitation status | ||
| Parents (include family) | 256 (53.1) | |
| Friend or colleague | 103 (21.4) | |
| Alone | 123 (25.5) | |
| Smartphone usage behaviors | ||
| Smartphone overdependence |
37.63±8.62 (10–60) | |
| High risk user | 376 (77.8) | |
| General user | 107 (22.2) | |
| Age at first smartphone use | ||
| Elementary school | 158 (32.8) | |
| Middle school | 229 (47.5) | |
| High school | 63 (13.1) | |
| University | 32 (6.6) | |
| Motivation for smartphone use | ||
| Latest trends | 66 (13.7) | |
| Information searching | 90 (18.7) | |
| Studying purposes | 25 (5.2) | |
| Forming relationships with others | 301 (62.4) | |
| Main usage of smartphone | ||
| Phone function (voice call, message, etc.) | 14 (2.9) | |
| Entertainment function |
67 (13.9) | |
| Information searching | 47 (9.7) | |
| SNS (KakaoTalk, Line, etc.) | 236 (49.0) | |
| Watching videos | 118 (24.5) | |
| Average smartphone usage time per day (hr) | 5.60±2.69 (0.75–16.00) | |
| During week average usage time (hr) | 5.22±2.75 (0.65–17.00) | |
| Weekend average usage time (hr) | 5.98±2.94 (0.50–16.00) | |
| Self-awareness of smartphone overdependence | ||
| Yes | 224 (46.5) | |
| No | 258 (53.5) | |
| Smartphone usage time after the COVID-19 (hr) | ||
| ≤1 | 147 (30.5) | |
| 2 | 114 (23.6) | |
| 3 | 119 (24.7) | |
| ≥4 | 102 (21.2) | |
| Satisfaction of smartphone usage for specific purposes |
||
| Information searching | 371 (77.0) | |
| Networking through SNS | 250 (51.9) | |
| Entertainment function |
161 (33.4) | |
| Financial benefits | 42 (8.7) | |
| Use for learning | 36 (7.5) | |
| Problematic smartphone use |
||
| Conflict with parents/family | 56 (11.6) | |
| Difficulties in interpersonal relationships | 58 (12.0) | |
| Excessive usage charges | 65 (13.5) | |
| Decreased health status | 196 (40.7) | |
| Decreased academic and work efficiency | 303 (62.9) | |
| Others | 28 (5.8) | |
| Health status related to smartphone use |
||
| Lack of sleep | 155 (32.2) | |
| Impaired vision and dry eye | 224 (46.5) | |
| Headache | 50 (10.4) | |
| Decreased concentration | 191 (39.6) | |
| Decreased physical strength | 35 (7.3) | |
| Musculoskeletal pain (neck, back, wrist, etc.) | 121 (25.1) | |
| Self-determination | 82.61±10.85 (39–108) | |
| Autonomy | 27.42±4.99 (10–36) | |
| Competence | 26.05±4.73 (10–36) | |
| Relatedness | 29.14±4.13 (16–36) | |
| Interpersonal | Social support | 48.70±7.64 (22–60) |
| Family support | 16.20±3.16 (4–20) | |
| Friend support | 16.22±2.93 (4–20) | |
| Significant other support | 16.29±2.96 (4–20) | |
| Family life satisfaction | 4.09±0.86 (1–5) | |
| Satisfied | 376 (78.0) | |
| Unsatisfied | 106 (22.0) | |
| Institutional & community | Perceived university environment | 2.62±0.78 (1–5) |
| Experience of receiving education on smartphone overdependence prevention | ||
| Yes | 115 (23.9) | |
| No | 367 (76.1) | |
| College life satisfaction | 3.54±0.88 (1–5) | |
| Satisfied | 264 (54.8) | |
| Unsatisfied | 218 (45.2) | |
| City size of residence |
||
| Metropolitan city | 347 (72.0) | |
| Small-medium size city | 135 (28.0) | |
| COVID-19 incidence rate |
109.19±73.36 (9.67–271.91) |
| Factor | Variable | Smartphone overdependence |
|
|---|---|---|---|
| Mean±SD | t or F (p) | ||
| Intrapersonal | Demographic characteristics | ||
| Gender | –6.70 (<.001) | ||
| Men | 34.47±8.83 | ||
| Women | 39.64±7.87 | ||
| College year | 1.93 (.124) | ||
| First year | 37.29±8.23 | ||
| Second year | 36.69±8.30 | ||
| Third year | 37.72±9.01 | ||
| Fourth year | 39.43±9.09 | ||
| Major department | 1.01 (.416) | ||
| Humanities | 39.01±9.13 | ||
| Social sciences | 37.52±8.06 | ||
| Education | 38.30±8.55 | ||
| Engineering & technology | 36.24±9.06 | ||
| Natural sciences | 37.13±8.05 | ||
| Nursing/health science | 38.42±8.38 | ||
| Art & physical | 37.95±8.63 | ||
| Residence type | 0.60 (.615) | ||
| Family home | 37.96±9.19 | ||
| Commute to college in other areas | 37.65±8.31 | ||
| Living outside of home | 37.94±7.83 | ||
| School dormitory | 36.65±8.63 | ||
| Cohabitation status | 0.41 (.667) | ||
| Parents (include family) | 37.89±8.97 | ||
| Friend or colleague | 36.98±8.92 | ||
| Alone | 37.64±7.60 | ||
| Smartphone usage behaviors | |||
| Age at first smartphone use | 0.61 (.611) | ||
| Elementary school | 37.81±7.99 | ||
| Middle school | 37.83±8.97 | ||
| High school | 36.27±8.93 | ||
| University | 38.03±8.63 | ||
| Motivation for smartphone use | 2.43 (.064) | ||
| Latest trends | 39.71±9.48 | ||
| Information searching | 37.97±8.33 | ||
| Studying purposes | 34.72±7.69 | ||
| Forming relationships with others | 37.32±8.53 | ||
| Main usage of smartphone | 1.00 (.406) | ||
| Phone function (voice call, message, etc.) | 35.93±8.49 | ||
| Entertainment function |
36.21±9.39 | ||
| Information searching | 36.98±8.77 | ||
| SNS (KakaoTalk, Line, etc.) | 38.29±8.41 | ||
| Watching video | 37.58±8.56 | ||
| Self-awareness of smartphone overdependence | –11.47 (<.001) | ||
| Yes | 41.92±7.08 | ||
| No | 33.91±8.11 | ||
| Smartphone usage time after the COVID-19 (hr) | 11.39 (<.001) a,b,c<d | ||
| ≤1a | 35.91±9.30 | ||
| 2b | 35.96±8.40 | ||
| 3c | 38.05±7.69 | ||
| ≥4d | 41.64±7.60 | ||
| Interpersonal | Family life satisfaction | 2.24 (.025) | |
| Satisfied | 37.16±8.52 | ||
| Unsatisfied | 39.28±8.82 | ||
| Institutional & community | Experience of receiving education on smartphone overdependence prevention | –0.15 (.877) | |
| Yes | 37.74±8.45 | ||
| No | 37.60±8.68 | ||
| College life satisfaction | 2.43 (.016) | ||
| Satisfied | 36.77±8.61 | ||
| Unsatisfied | 38.67±8.54 | ||
| City size of residence |
0.86 (.390) | ||
| Metropolitan city | 37.84±8.56 | ||
| Small-medium size city | 37.09±8.80 | ||
| Factors | Variable | x1 | x2 | x3 | x4 | x5 | x6 | x7 | x8 | x9 | x10 | x11 |
|---|---|---|---|---|---|---|---|---|---|---|---|---|
| Smartphone overdependence | x1 | 1 | ||||||||||
| Intrapersonal | x2 | -.09 (.049) | 1 | |||||||||
| x3 | .34 (<.001) | -.17 (<.001) | 1 | |||||||||
| x4 | -.27 (<.001) | -.05 (.305) | -.05 (.236) | 1 | ||||||||
| x5 | -.13 (.003) | .02 (.614) | -.10 (.035) | .44 (<.001) | 1 | |||||||
| x6 | -.03 (.472) | -.14 (.002) | .06 (.223) | .42 (<.001) | .39 (<.001) | 1 | ||||||
| Interpersonal | x7 | -.06 (.179) | -.08 (.073) | .02 (.715) | .29 (<.001) | .32 (<.001) | .51 (<.001) | 1 | ||||
| x8 | .04 (.441) | -.14 (.003) | .09 (.056) | .31 (<.001) | .30 (<.001) | .69 (<.001) | .49 (<.001) | 1 | ||||
| x9 | -.03 (.507) | -.08 (.092) | .03 (.460) | .22 (<.001) | .31 (<.001) | .56 (<.001) | .57 (<.001) | .64 (<.001) | 1 | |||
| Institutional & community | x10 | -.05 (.286) | -.14 (.002) | .02 (.650) | -.04 (.365) | .04 (.330) | .07 (.109) | .12 (.011) | .15 (.001) | .14 (.002) | 1 | |
| x11 | .03 (.477) | -.08 (.090) | .01 (.818) | .01 (.817) | .07 (.139) | .04 (.438) | -.07 (.117) | -.00 (.993) | .05 (.244) | .01 (.817) | 1 |
| Level | Variable | Model I |
Model II |
Model III |
||||||
|---|---|---|---|---|---|---|---|---|---|---|
| β | SE | t (p) | β | SE | t (p) | β | SE | t (p) | ||
| Intrapersonal | (constants) | - | 6.09 | 8.72 (<.001) | - | 6.36 | 7.92 (<.001) | - | 7.00 | 6.87 (<.001) |
| Gender |
||||||||||
| Women | .15 | 0.77 | 3.35 (<.001) | .15 | 0.77 | 3.55 (<.001) | .15 | 0.78 | 3.43 (.001) | |
| Age | –.14 | 0.26 | –2.27 (.024) | –.13 | 0.26 | –2.14 (.033) | –.12 | 0.27 | –1.99 (.047) | |
| College year |
||||||||||
| Second year | .01 | 0.89 | 0.27 (.790) | .00 | 0.89 | 0.09 (.931) | .01 | 0.90 | 0.13 (.898) | |
| Third year | .10 | 1.12 | 1.83 (.067) | .10 | 1.19 | 1.77 (.077) | .10 | 1.12 | 1.78 (.076) | |
| Fourth year | .16 | 1.36 | 2.54 (.011) | .15 | 1.36 | 2.39 (.017) | .15 | 1.37 | 2.33 (.020) | |
| Average smartphone usage time per day | .20 | 0.13 | 4.96 (<.001) | .18 | 0.13 | 4.65 (<.001) | .18 | 0.13 | 4.58 (<.001) | |
| Motivation for smartphone use |
||||||||||
| Information searching | –.10 | 1.14 | –1.97 (.049) | –.08 | 1.15 | –1.57 (.118) | –.08 | 1.16 | –1.46 (.144) | |
| Studying purposes | –.09 | 1.66 | –2.10 (.036) | –.08 | 1.66 | –1.90 (.059) | –.08 | 1.67 | –1.91 (.057) | |
| Forming relationships with others | –.16 | 0.97 | –2.93 (.004) | –.15 | 0.97 | –2.77 (.006) | –.15 | 0.97 | –2.66 (.008) | |
| Self-awareness of smartphone overdependence: yes |
.33 | 0.70 | 8.18 (<.001) | .33 | 0.70 | 8.11 (<.001) | .33 | 0.71 | 8.06 (<.001) | |
| Self-determination | ||||||||||
| Autonomy | –.23 | 0.07 | –5.57 (<.001) | –.25 | 0.07 | –5.82 (<.001) | –.25 | 0.08 | –5.79 (<.001) | |
| Competence | .03 | 0.08 | 0.80 (.425) | .02 | 0.08 | 0.48 (.630) | .02 | 0.08 | 0.41 (.681) | |
| Interpersonal | Social support | |||||||||
| Family support | .03 | 0.14 | 0.47 (.640) | .03 | 0.15 | 0.57 (.569) | ||||
| Friend support | .14 | 0.15 | 2.78 (.006) | .14 | 0.15 | 2.78 (.006) | ||||
| Special person support | –.07 | 0.15 | –1.27 (.203) | –.07 | 0.16 | –1.37 (.173) | ||||
| Satisfaction with family life: satisfied |
–.07 | 0.93 | –1.49 (.138) | –.07 | 0.95 | –1.53 (.127) | ||||
| Institutional & community | Perceived university environment | –.00 | 0.44 | –0.09 (.925) | ||||||
| Satisfaction of college life: satisfied |
.02 | 0.71 | 0.36 (.718) | |||||||
| City size of residence: small-medium size city |
–.02 | -0.75 | –0.42 (.677) | |||||||
| COVID-19 incidence rate |
.04 | 0.46 | 1.03 (.302) | |||||||
| R2 (adjusted R2) | .36 (.345) | .37 (.353) | .38 (.349) | |||||||
| △R2 | .36 | .01 | .00 | |||||||
| F (p) | 22.07 (<.001) | 17.38 (<.001) | 13.92 (<.001) | |||||||
| △F (p) | 22.07 (<.001) | 2.47 (.044) | 0.42 (.796) | |||||||
Table 1. Ecological characteristics of participants (n=482)
Values are presented as number (%) or mean±standard deviation (range). COVID-19, coronavirus disease 2019; SNS, social network service. a)Smartphone overdependence criteria: Men: ≥31, Women: ≥33. b)Game, hobby, music, movie, etc. c)Multiple response. d)City size classification criteria: large metropolitan area, 1 million or more; metropolitan area, 500,000 or more and less than 1 million; small-medium size area, less than 500,000 according to population data from the National Environment Information Network System (
Table 2. Degree of smartphone overdependence according to ecological factors (n=482)
COVID-19, coronavirus disease 2019; SD, standard deviation; SNS, social network service. a)Game, hobby, music, movie, etc. b)City size classification criteria: large metropolitan area, 1 million or more; metropolitan area, 500,000 or more and less than 1 million; small-medium size area, less than 500,000 according to population data from the National Environment Information Network System (
Table 3. Correlation between smartphone overdependence and ecological factors (n=482)
x1, smartphone overdependence; x2, age; x3, average smartphone usage time per day (hr); x4, autonomy; x5, competence; x6, relatedness; x7, family support; x8, friend support; x9, significant other support; x10, perceived university environment; x11, COVID-19 incidence rate (from October 1, 2020 to March 25, 2021). COVID-19, coronavirus disease 2019.
Table 4. Factor influencing smartphone overdependence of university students (n=482)
COVID-19, coronavirus disease 2019; SE, standard error. a)Reference of dummy variables: gender, Men; college year, first year; motivation for smartphone use, latest trend; self-awareness of smartphone overdependence, no; satisfaction with family life, unsatisfied; satisfaction of college life, unsatisfied; city size of residence, metropolitan city. b)City size classification criteria: large metropolitan area, 1 million or more; metropolitan area, 500,000 or more and less than 1 million; small-medium size area, less than 500,000 according to population data from the National Environment Information Network System (

