 Submit an article
Articles
- Page Path
- HOME > J Korean Acad Nurs > Volume 55(1); 2025 > Article
-
Research Paper
- Serial mediation effects of social support and antepartum depression on the relationship between fetal attachment and anxiety in high-risk pregnant couples of South Korea
-
Mihyeon Park1
 , Sukhee Ahn2
 -
Journal of Korean Academy of Nursing 2025;55(1):19-33.
DOI: https://doi.org/10.4040/jkan.24070
Published online: February 4, 2025
1Department of Nursing, Baekseok Culture University, Cheonan, Korea
2College of Nursing, Chungnam National University, Daejeon, Korea
- Corresponding author: Sukhee Ahn College of Nurisng, Chungnam National University, 266 Munhwa-ro, Jung-gu, Daejeon 35015, Korea E-mail: sukheeahn@cnu.ac.kr
• Received: June 25, 2024 • Revised: September 2, 2024 • Accepted: October 10, 2024
© 2025 Korean Society of Nursing Science
This is an Open Access article distributed under the terms of the Creative Commons Attribution NoDerivs License (http://creativecommons.org/licenses/by-nd/4.0) If the original work is properly cited and retained without any modification or reproduction, it can be used and re-distributed in any format and medium.
- 3,384 Views
- 280 Download
Abstract
-
Purpose
- This study examined the direct effects of fetal attachment, social support, and antepartum depression on anxiety in pregnant women with high-risk pregnancy-related conditions and their husbands. Furthermore, it aimed to explore the serial mediation effects of social support and antepartum depression in the relationship between fetal attachment and anxiety.
-
Methods
- A survey-based study was conducted among pregnant women diagnosed with high-risk pregnancy conditions at 24–32 weeks and their husbands, recruited from a pregnant women’s online community between January 20, 2021 and July 20, 2022. Data were collected from 294 individuals (147 couples) using self-report questionnaires. Correlations between variables were analyzed using the IBM SPSS software ver. 26.0 (IBM Corp.), and the mediation effects were assessed using the PROCESS macro, model 6.
-
Results
- In the maternal model, maternal-fetal attachment directly affected anxiety (p=.005), with antepartum depression partially mediating this relationship (95% confidence interval [CI], –0.26 to –0.01). In the paternal model, paternal-fetal attachment had no direct effect on anxiety (p=.458). However, social support and antepartum depression fully mediated the relationship between paternal-fetal attachment and anxiety (95% CI, –0.14 to –0.03).
-
Conclusion
- The findings indicate that social support in the relationship between fetal attachment and depression in high-risk pregnant women and their partners can have direct or indirect effects on the negative emotions of high-risk pregnant couples. It is necessary to assess the level of anxiety in couples experiencing high-risk pregnancies and provide comprehensive nursing interventions that address fetal attachment, social support, and antepartum depression in order to reduce anxiety.
Introduction
Methods
1) Parent-fetal attachment
(1) Paternal-fetal attachment
(2) Maternal-fetal attachment
2) Social support
3) Antepartum depression
4) Anxiety
Results
Discussion
Conclusion
-
Conflicts of Interest
No potential conflict of interest relevant to this article was reported.
-
Acknowledgements
None.
-
Funding
This work was supported by the National Research Foundation of Korea fund in 2020-2024 (NRF no., 2020R1A2C201086511).
-
Data Sharing Statement
Please contact the corresponding author for data availability.
-
Author Contributions
Conceptualization or/and Methodology: MP, SA. Data curation or/and Analysis: MP, SA. Funding acquisition: SA. Investigation: MP, SA. Project administration or/and Supervision: SA. Resources or/and Software: MP, SA. Validation: MP, SA. Visualization: MP. Writing original draft or/and Review & Editing: MP, SA. Final approval of the manuscript: MP, SA.
Article Information
Fig. 1.
Serial mediating effect in high-risk pregnant women and men. (A) Model for women. (B) Model for men. c’ (c), direct effect (total effect).
All coefficients are presented as standard effects: *p<.05, **p<.01, and ***p<.001.

Table 1.Differences in anxiety according to subjects’ characteristics in high-risk pregnancy couples (N=294)
Table 2.Differences in study variables between women and men who experienced high-risk pregnancy (N=294)
Table 3.Relationships among fetal attachment, social support, antepartum depression, and anxiety in women and men who experienced high-risk pregnancy (N=294)
The left row shows the correlation coefficient between study variables in women with high-risk pregnancies. The upper column shows the correlation coefficient between variables measured in the husbands (men) of high-risk pregnant women.
a)Correlations assessed between males’ and females’ reports are shown in the blank diagonal (147 couples).
Table 4.Mediation effects of social support and antepartum depression in the relationship between fetal attachment and anxiety in women and men who experienced high-risk pregnancy (N=294)
- 1. Health Insurance Review and Assessment Service. Marriage divorce statistics 2022 [Internet]. Statistics Korea; 2022 [cited 2023 Sep 1]. Available from: https://kostat.go.kr/board.es?mid=a10301010000&bid=204&list_no=424356&act=view&mainXml=Y
- 2. Health Insurance Review and Assessment Service. Birth statistics 2021 [Internet]. Statistics Korea; 2022 [cited 2023 Sep 1]. Available from: https://kostat.go.kr/board.es?mid=a10301010000&bid=204&list_no=426806&act=view&mainXml=Y
- 3. Choi H, Nho JH, Yi N, Park S, Kang B, Jang H. Maternal, infant, and perinatal mortality statistics and trends in Korea between 2018 and 2020. Korean J Women Health Nurs. 2022;28(4):348-357. https://doi.org/10.4069/kjwhn.2022.12.23ArticlePubMedPMC
- 4. Health Insurance Review and Assessment Service (HIRA). Statistics of national diseases of interest [Internet]. HIRA; 2020 [cited 2023 Sep 1]. Available from: https://opendata.hira.or.kr/op/opc/olapMfrnIntrsIlnsInfoTab1.do
- 5. Hwang JY. Reclassification of high-risk pregnancy for maternal-fetal healthcare providers. J Korean Soc Matern Child Health. 2020;24(2):65-74. https://doi.org/10.21896/jksmch.2020.24.2.65Article
- 6. Unlu Bidik N, Hamlaci Baskaya Y. Expectant fathers’ perceptions towards high-risk pregnancy and experiences in this period: a study of hermeneutic phenomenology. Appl Nurs Res. 2022;68:151639. https://doi.org/10.1016/j.apnr.2022.151639ArticlePubMed
- 7. Göbel A, Stuhrmann LY, Harder S, Schulte-Markwort M, Mudra S. The association between maternal-fetal bonding and prenatal anxiety: an explanatory analysis and systematic review. J Affect Disord. 2018;239:313-327. https://doi.org/10.1016/j.jad.2018.07.024ArticlePubMed
- 8. Park M, Ahn S. An explanatory model of quality of life in high-risk pregnant women in Korea: a structural equation model. Korean J Women Health Nurs. 2023;29(4):302-316. https://doi.org/10.4069/kjwhn.2023.11.13.1ArticlePubMedPMC
- 9. Shariatpanahi M, Faramarzi M, Barat S, Farghadani A, Shirafkan H. Prevalence and risk factors of prenatal anxiety disorders: a cross-sectional study. Health Sci Rep. 2023;6(8):e1491. https://doi.org/10.1002/hsr2.1491ArticlePubMedPMC
- 10. Han RR, Xiang ZX, Zhang SH, Gao LL. Predictors of anxiety among pregnant women with gestational diabetes mellitus and their partners: the mediating role of marital satisfaction. Int J Nurs Pract. 2024;30(1):e13155. https://doi.org/10.1111/ijn.13155ArticlePubMed
- 11. Smorti M, Ginobbi F, Simoncini T, Pancetti F, Carducci A, Mauri G, et al. Anxiety and depression in women hospitalized due to high-risk pregnancy: an integrative quantitative and qualitative study. Curr Psychol. 2023;42(7):5570-5579. https://doi.org/10.1007/s12144-021-01902-5Article
- 12. Hajikhani NA, Ozgoli G, Pourebrahim T, Mehrabi Y. Predictors of mental health during high-risk pregnancy. Crescent J Med Biol Sci. 2020;7(1):54.
- 13. Yoo Y, Park H. Effect of social support, resilience, and fetal attachment on state anxiety of pregnant women with preterm labor. J Korea Acad Ind Coop Soc. 2023;24(2):133-144. https://doi.org/10.5762/KAIS.2023.24.2.133Article
- 14. Papapetrou C, Panoulis K, Mourouzis I, Kouzoupis A. Pregnancy and the perinatal period: the impact of attachment theory. Psychiatriki. 2020;31(3):257-270. https://doi.org/10.22365/jpsych.2020.313.257ArticlePubMed
- 15. Branjerdporn G, Meredith P, Strong J, Garcia J. Associations between maternal-foetal attachment and infant developmental outcomes: a systematic review. Matern Child Health J. 2017;21(3):540-553. https://doi.org/10.1007/s10995-016-2138-2ArticlePubMed
- 16. Shen F, Liu Y, Brat M. Attachment, self-esteem, and psychological distress: a multiple-mediator model. Professional Counselor. 2021;11(2):129-142. https://doi.org/10.15241/fs.11.2.129Article
- 17. Bretherton I. Attachment theory: retrospect and prospect. Monogr Soc Res Child Dev. 1985;50(1-2):3-35. https://doi.org/10.2307/3333824Article
- 18. Palma E, Armijo I, Cifuentes J, Ambiado S, Rochet P, Díaz B, et al. Hospitalisation in high-risk pregnancy patients: is prenatal attachment affected? J Reprod Infant Psychol. 2021;39(1):30-42. https://doi.org/10.1080/02646838.2020.1740661ArticlePubMed
- 19. Liu CH, Hyun S, Mittal L, Erdei C. Psychological risks to mother-infant bonding during the COVID-19 pandemic. Pediatr Res. 2022;91(4):853-861. https://doi.org/10.1038/s41390-021-01751-9ArticlePubMedPMC
- 20. Baldwin S, Malone M, Sandall J, Bick D. Mental health and wellbeing during the transition to fatherhood: a systematic review of first time fathers’ experiences. JBI Database System Rev Implement Rep. 2018;16(11):2118-2191. https://doi.org/10.11124/JBISRIR-2017-003773ArticlePubMedPMC
- 21. Kang DI, Park E. Do taegyo practices, self-esteem, and social support affect maternal-fetal attachment in high-risk pregnant women?: a cross-sectional survey. Korean J Women Health Nurs. 2022;28(4):338-347. https://doi.org/10.4069/kjwhn.2022.12.16ArticlePubMedPMC
- 22. Kim EM, Hong S. Impact of uncertainty on the anxiety of hospitalized pregnant women diagnosed with preterm labor: focusing on mediating effect of uncertainty appraisal and coping style. J Korean Acad Nurs. 2018;48(4):485-496. https://doi.org/10.4040/jkan.2018.48.4.485ArticlePubMed
- 23. Kozel E, Barnoy S, Itzhaki M. Emotion management of women at risk for premature birth: the association with optimism and social support. Appl Nurs Res. 2022;64:151568. https://doi.org/10.1016/j.apnr.2022.151568ArticlePubMed
- 24. Beesley A, Karwatzki E, Sullivan K. Anxiety and depression symptoms in fathers during their partner’s pregnancy: how does this impact paternal fetal attachment? J Prenat Perinat Psychol Health. 2019;33(3):221.
- 25. Calli B, Dikmen HA. The relationship between spousal support and depression, anxiety, stress, and prenatal attachment in high-risk pregnancies. Ann Med Res. 2023;30(6):692-698. https://doi.org/10.5455/annalsmedres.2023.03.070Article
- 26. Pisoni C, Garofoli F, Tzialla C, Orcesi S, Spinillo A, Politi P, et al. Complexity of parental prenatal attachment during pregnancy at risk for preterm delivery. J Matern Fetal Neonatal Med. 2016;29(5):771-776. https://doi.org/10.3109/14767058.2015.1017813ArticlePubMed
- 27. Strobe checklists: cross-sectional studies [Internet]. STROBE; 2023 [cited 2023 Sep 1]. Available from: https://www.strobe-statement.org/
- 28. Lee SH, Lee EY. The Influence of anxiety and dyadic adjustment on maternal-fetal attachment in high-risk pregnant women. Int J Softw Eng Its Appl. 2015;9(12):361-372. https://doi.org/10.14257/ijseia.2015.9.12.32Article
- 29. Alves S, Fonseca A, Canavarro MC, Pereira M. Dyadic coping and dyadic adjustment in couples with women with high depressive symptoms during pregnancy. J Reprod Infant Psychol. 2018;36(5):504-518. https://doi.org/10.1080/02646838.2018.1490496ArticlePubMed
- 30. Noh NI, Yeom HA. Development of the Korean Paternal-Fetal Attachment Scale (K-PAFAS). Asian Nurs Res (Korean Soc Nurs Sci). 2017;11(2):98-106. https://doi.org/10.1016/j.anr.2017.05.001ArticlePubMed
- 31. Cranley MS. Development of a tool for the measurement of maternal attachment during pregnancy. Nurs Res. 1981;30(5):281-284. https://doi.org/10.1097/00006199-198109000-00008ArticlePubMed
- 32. Kim GY. Effects on maternal-infant attachment by the taegyo perspective prenatal class [master’s thesis]. Seoul: Yonsei University; 2000.
- 33. Zimet GD, Dahlem NW, Zimet SG, Farley GK. The multidimensional scale of perceived social support. J Pers Assess. 1988;52(1):30-41. https://doi.org/10.1207/s15327752jpa5201_2Article
- 34. Kim YK, Lim KH. Risk factors for premature birth among premature obstetric labor women: a prospective cohort study. Korean J Women Health Nurs. 2018;24(3):233-242. https://doi.org/10.4069/kjwhn.2018.24.3.233ArticlePubMed
- 35. Cox JL, Holden JM, Sagovsky R. Detection of postnatal depression: development of the 10-item Edinburgh Postnatal Depression Scale. Br J Psychiatry. 1987;150:782-786. https://doi.org/10.1192/bjp.150.6.782ArticlePubMed
- 36. Kim YK, Hur JW, Kim KH, Oh KS, Shin YC. Clinical application of Korean version of Edinburgh Postnatal Depression Scale. J Korean Neuropsychiatr Assoc. 2008;47(1):36-44.
- 37. Koh M, Ahn S, Kim J, Park S, Oh J. Pregnant women’s antenatal depression and influencing factors. Korean J Women Health Nurs. 2019;25(1):112-123. https://doi.org/10.4069/kjwhn.2019.25.1.112ArticlePubMed
- 38. Spielberger CD, Gonzalez-Reigosa F, Martinez-Urrutia A, Natalicio LF, Natalicio DS. The state-trait anxiety inventory. Interam J Psychol [Internet]. 1971 [cited 2023 Sep 1];5(3-4):145-158. Available from: https://journal.sipsych.org/index.php/IJP/article/view/620/524
- 39. Kim CT, Shin DK. A study based on the standardization of the STAI for Korea. New Med J. 1978;21(11):69-75.
- 40. Hayes AF. Introduction to mediation, moderation, and conditional process analysis: a regression-based approach. 2nd ed. Guilford publications; 2017.
- 41. Kang SK, Chung MR. The relationship between pregnant woman's stress, temperament and maternal-fetal attachment. Korean J Hum Ecol. 2012;21(2):213-223. https://doi.org/10.5934/KJHE.2012.21.2.213Article
- 42. Yoon SH, Sung MH. Does family support mediate the effect of anxiety and depression on maternal-fetal attachment in high-risk pregnant women admitted to the maternal-fetal intensive care unit? Korean J Women Health Nurs. 2021;27(2):104-112. https://doi.org/10.4069/kjwhn.2021.05.14ArticlePubMedPMC
- 43. Kim JH, Song YA. Health promoting behavior in pregnant couples: actor-partner interdependence model analysis. J Korean Acad Nurs. 2017;47(4):467-475. Korean. https://doi.org/10.4040/jkan.2017.47.4.467ArticlePubMed
- 44. Seo HJ, Song JE, Lee Y, Ahn JA. Effects of stress, depression, and spousal and familial support on maternal identity in pregnant women. Korean J Women Health Nurs. 2020;26(1):84-92. https://doi.org/10.4069/kjwhn.2020.03.17ArticlePubMedPMC
- 45. Oh J, Ahn S. Predictors of antenatal depression in pregnant couples. Clin Nurs Res. 2022;31(5):881-890. https://doi.org/10.1177/10547738211065238ArticlePubMed
- 46. Kannenberg K, Weichert J, Rody A, Banz-Jansen C. Treatment-associated anxiety among pregnant women and their partners: what is the influence of sex, parity, age and education? Geburtshilfe Frauenheilkd. 2016;76(7):809-813. https://doi.org/10.1055/s-0042-101546ArticlePubMedPMC
- 47. Hajikhani NA, Ozgoli G, Pourebrahim T, Mehrabi Y, Khoori E. Characterizing mental health status of couples in high-risk pregnancy and its relevant characteristics. Int J Womens Health Reprod Sci. 2018;6(4):465-470. https://doi.org/10.15296/ijwhr.2018.77Article
- 48. Chen J, Cai Y, Liu Y, Qian J, Ling Q, Zhang W, et al. Factors associated with significant anxiety and depressive symptoms in pregnant women with a history of complications. Shanghai Arch Psychiatry. 2016;28(5):253-262. https://doi.org/10.11919/j.issn.1002-0829.216035ArticlePubMedPMC
- 49. Chae JY. The influence of pregnant couples’ attachment representation for parents of origin on their psychological symptoms. Fam Environ Res. 2019;57(1):41-50. https://doi.org/10.6115/fer.2019.004Article
- 50. Koh M, Kim J, Yoo H, Kim SA, Ahn S. Development and application of a couple-centered antenatal education program in Korea. Korean J Women Health Nurs. 2021;27(2):141-152. https://doi.org/10.4069/kjwhn.2021.06.20ArticlePubMedPMC
- 51. Hopkins J, Miller JL, Butler K, Gibson L, Hedrick L, Boyle DA. The relation between social support, anxiety and distress symptoms and maternal fetal attachment. J Reprod Infant Psychol. 2018;36(4):381-392. https://doi.org/10.1080/02646838.2018.1466385ArticlePubMed
- 52. Zhou XL, Liu H, Li XH, Li F, Zhang SM, Zhang SR. Mediating effects of social support between antenatal depression and fear of childbirth among nulliparous woman. Ann Palliat Med. 2021;10(6):6399-6409. https://doi.org/10.21037/apm-21-854ArticlePubMed
- 53. Göbel A, Barkmann C, Arck P, Hecher K, Schulte-Markwort M, Diemert A, et al. Couples’ prenatal bonding to the fetus and the association with one’s own and partner’s emotional well-being and adult romantic attachment style. Midwifery. 2019;79:102549. https://doi.org/10.1016/j.midw.2019.102549ArticlePubMed
- 54. Jackson K, Erasmus E, Mabanga N. Fatherhood and high-risk pregnancy: a scoping review. BMC Pregnancy Childbirth. 2023;23(1):168. https://doi.org/10.1186/s12884-023-05422-xArticlePubMedPMC
References
Appendix
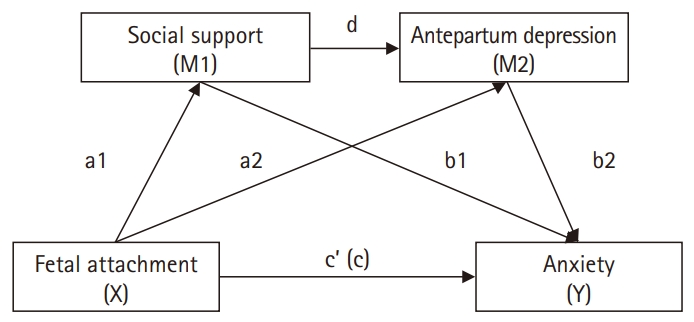
Figure & Data
REFERENCES
Citations
Citations to this article as recorded by 
 ePub Link
 Cite
CiteSerial mediation effects of social support and antepartum depression on the relationship between fetal attachment and anxiety in high-risk pregnant couples of South Korea
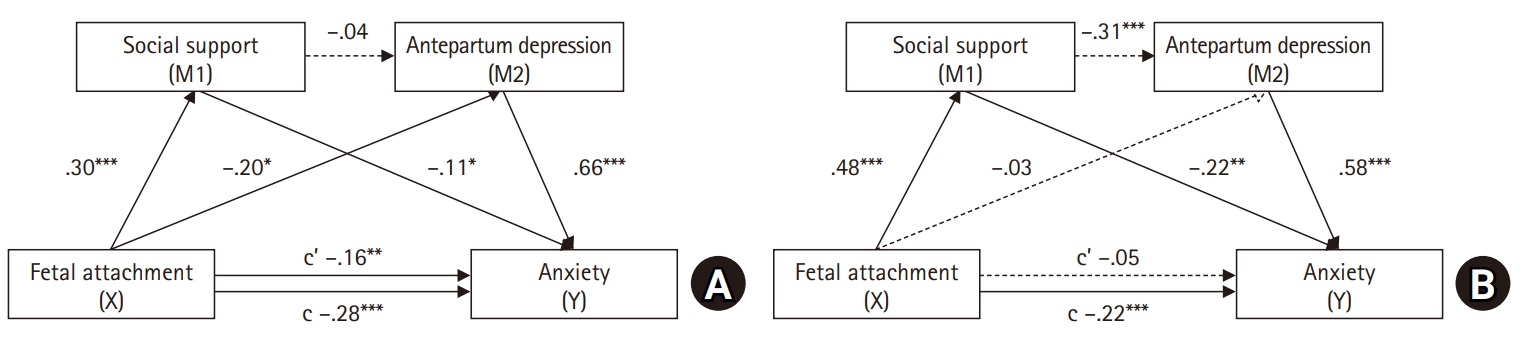
Fig. 1. Serial mediating effect in high-risk pregnant women and men. (A) Model for women. (B) Model for men. c’ (c), direct effect (total effect).All coefficients are presented as standard effects: *p<.05, **p<.01, and ***p<.001.
Fig. 1.
Serial mediation effects of social support and antepartum depression on the relationship between fetal attachment and anxiety in high-risk pregnant couples of South Korea
| Characteristic | Women (n=147) | Men (n=147) | ||||
|---|---|---|---|---|---|---|
| No. (%) | Mean±SD | t or F (p) | No. (%) | Mean±SD | t or F (p) | |
| Age (yr) | 0.42 (.658) | 1.89 (.154) | ||||
| ≤29 | 5 (3.4) | 42.8±10.41 | 1 (0.7) | 38.0±0.00 | ||
| 30–39 | 119 (81.0) | 44.3±10.41 | 104 (70.7) | 38.0±8.82 | ||
| ≥40 | 23 (15.6) | 42.2±9.41 | 42 (28.6) | 41.5±11.61 | ||
| Education | 1.22 (.300) | 0.12 (.887) | ||||
| High school | 8 (5.4) | 42.25±8.14 | 19 (12.9) | 39.79±7.65 | ||
| College | 104 (70.8) | 44.80±10.66 | 101 (68.7) | 39.11±10.02 | ||
| Graduate | 35 (23.8) | 41.83±9.35 | 27 (18.4) | 38.37±10.35 | ||
| Working status | 3.29 (.001) | 2.91 (.004) | ||||
| Working | 53 (36.1) | 40.36±10.14 | 144 (98.0) | 38.77±9.50 | ||
| Not working/parental leave | 94 (63.9) | 45.97±9.82 | 3 (2.0) | 55.00±11.53 | ||
| Monthly income (1 million KRW) | 1.91 (.058) | 0.25 (.805) | ||||
| ≤399 | 43 (29.3) | 46.44±8.76 | 39.37±8.66 | |||
| ≥400 | 104 (70.7) | 42.95±10.75 | 38.93±10.22 | |||
| Planned pregnancy | –1.45 (.149) | 0.45 (.653) | ||||
| Yes | 112 (76.2) | 43.27±9.80 | 39.69±9.68 | |||
| No | 35 (23.8) | 46.14±11.53 | 37.06±9.88 | |||
| Physical discomfort (0–100) | 4.24 (.016)a<b,c | |||||
| Low (0–33)a | 13 (8.9) | 37.85±10.65 | ||||
| Moderate (34–66)b | 45 (30.6) | 42.36±9.59 | ||||
| High (67–100)c | 89 (60.5) | 45.65±10.18 | ||||
| Mother’s health status | 25.09 (<.001)a,b<c | |||||
| Gooda | 37 (25.2) | 37.73±7.15 | ||||
| Moderateb | 61 (41.5) | 42.16±8.50 | ||||
| Poorc | 49 (33.3) | 50.88±10.46 | ||||
| Fetus health status | 10.06 (<.001)a<c | |||||
| Gooda | 105 (71.4) | 41.71±9.17 | ||||
| Moderateb | 39 (26.5) | 49.33±11.04 | ||||
| Poorc | 3 (2.1) | 52.67±7.77 | ||||
| Variable | Women (n=147) | Men (n=147) | t or χ2 | p |
|---|---|---|---|---|
| Fetal attachment | 77.16±10.04 | 83.18±11.77 | –4.71 | <.001 |
| Social support | 48.80±7.56 | 48.88±7.16 | –0.09 | .924 |
| Antepartum depression | 7.81±5.20 | 5.80±5.18 | 3.31 | .001 |
| EPDS score | 3.42 | .064 | ||
| <10 | 101 (68.7) | 115 (78.2) | ||
| ≥10 (at risk) | 46 (31.3) | 32 (21.8) | ||
| Anxiety | 43.95±10.27 | 39.06±9.76 | 4.18 | <.001 |
| Anxiety score | 2.80 | .094 | ||
| <45 | 83 (56.5) | 97 (66.0) | ||
| ≥45 (high) | 64 (43.5) | 50 (34.0) |
| Women | Men | |||||||
|---|---|---|---|---|---|---|---|---|
| Fetal attachment | Social support | Antenatal depression | Anxiety | |||||
| r | p | r | p | r | p | r | p | |
| Fetal attachment | .17a) | .034 | .48 | <.001 | –.18 | .025 | –.26 | .001 |
| Social support | .30 | <.001 | .33a) | <.001 | –.32 | <.001 | –.44 | <.001 |
| Antepartum depression | –.22 | .006 | –.11 | .176 | .26a) | .001 | .66 | <.001 |
| Anxiety | –.35 | <.001 | –.24 | .003 | .72 | <.001 | .34a) | <.001 |
| Variable | Women (n=147) | Men (n=147) | ||||||
|---|---|---|---|---|---|---|---|---|
| β | t | p | 95% CI | β | t | p | 95% CI | |
| Direct effect | ||||||||
| Fetal attachment (X) → social support (M1) | 0.30 | 3.90 | <.001 | 0.09 to 0.27 | 0.48 | 6.75 | <.001 | 0.21 to 0.38 |
| Fetal attachment (X)→ antepartum depression (M2) | –0.20 | –2.46 | .015 | –0.15 to –0.01 | –0.03 | –0.34 | .729 | –0.09 to 0.06 |
| Social support (M1) → antepartum depression (M2) | –0.04 | –0.55 | .577 | –0.14 to 0.08 | –0.31 | –3.47 | <.001 | –0.35 to –0.09 |
| Fetal attachment (X) → anxiety (Y) | –0.16 | –2.81 | .005 | –0.23 to –0.04 | –0.05 | –0.74 | .458 | –0.15 to 0.06 |
| Social support (M1) → anxiety (Y) | –0.11 | –2.06 | .040 | –0.31 to –0.01 | –0.22 | –3.21 | .001 | –0.50 to –0.11 |
| Antepartum depression (M2) → anxiety (Y) | 0.66 | 11.86 | <.001 | 1.10 to 1.54 | 0.58 | 9.26 | <.001 | 0.85 to 1.32 |
| Indirect effect | ||||||||
| Total | –0.18 | –0.31 to –0.06 | –0.21 | –0.35 to –0.08 | ||||
| Indirect 1: fetal attachment (X) → social support (M1) → anxiety (Y) | –0.03 | –0.09 to 0.09 | –0.11 | –0.18 to –0.04 | ||||
| Indirect 2: fetal attachment (X) → antepartum depression (M2) → anxiety (Y) | –0.14 | –0.26 to –0.01 | –0.01 | –0.13 to 0.09 | ||||
| Indirect 3: fetal attachment (X) → social support (M1) → antepartum depression (M2) → anxiety (Y) | –0.01 | –0.04 to 0.02 | –0.08 | –0.14 to –0.03 | ||||
| Total effect | ||||||||
| Fetal attachment (X) → anxiety (Y) | –0.28 | –4.54 | <.001 | –0.41 to –0.16 | –0.22 | –3.36 | <.001 | –0.35 to –0.09 |
Table 1. Differences in anxiety according to subjects’ characteristics in high-risk pregnancy couples (N=294)
SD, standard deviation; KRW, Korean won.
Table 2. Differences in study variables between women and men who experienced high-risk pregnancy (N=294)
Values are presented as mean±standard deviation or number (%). The fetal attachment score for the woman in the pair, normalized to a 100-point scale. EPDS, Edinburgh Postnatal Depression Scale.
Table 3. Relationships among fetal attachment, social support, antepartum depression, and anxiety in women and men who experienced high-risk pregnancy (N=294)
The left row shows the correlation coefficient between study variables in women with high-risk pregnancies. The upper column shows the correlation coefficient between variables measured in the husbands (men) of high-risk pregnant women. a)Correlations assessed between males’ and females’ reports are shown in the blank diagonal (147 couples).
Table 4. Mediation effects of social support and antepartum depression in the relationship between fetal attachment and anxiety in women and men who experienced high-risk pregnancy (N=294)
CI, confidence interval.

