Articles
- Page Path
- HOME > J Korean Acad Nurs > Volume 50(6); 2020 > Article
- Research Paper Cut-Off Values of the Post-Intensive Care Syndrome Questionnaire for the Screening of Unplanned Hospital Readmission within One Year
- Jiyeon Kang, Yeon Jin Jeong, Jiwon Hong
-
Journal of Korean Academy of Nursing 2020;50(6):787-798.
DOI: https://doi.org/10.4040/jkan.20233
Published online: December 31, 2020

2Department of Nursing, Dongju College, Busan, Korea

Abstract
Purpose
This study aimed to assign weights for subscales and items of the Post-Intensive Care Syndrome questionnaire and suggest optimal cut-off values for screening unplanned hospital readmissions of critical care survivors.
Methods
Seventeen experts participated in an analytic hierarchy process for weight assignment. Participants for cut-off analysis were 240 survivors who had been admitted to intensive care units for more than 48 hours in three cities in Korea. We assessed participants using the 18-item Post-Intensive Care Syndrome questionnaire, generated receiver operating characteristic curves, and analysed cut-off values for unplanned readmission based on sensitivity, specificity, and positive likelihood ratios.
Results
Cognitive, physical, and mental subscale weights were 1.13, 0.95, and 0.92, respectively.
Incidence of unplanned readmission was 25.4%. Optimal cut-off values were 23.00 for raw scores and 23.73 for weighted scores (total score 54.00), with an area of under the curve (AUC) of .933 and .929, respectively. There was no significant difference in accuracy for original and weighted scores.
Conclusion
The optimal cut-off value accuracy is excellent for screening of unplanned readmissions. We recommend that nurses use the Post-Intensive Care Syndrome Questionnaire to screen for readmission risk or evaluating relevant interventions for critical care survivors.
Published online Dec 31, 2020.
https://doi.org/10.4040/jkan.20233
Cut-Off Values of the Post-Intensive Care Syndrome Questionnaire for the Screening of Unplanned Hospital Readmission within One Year
Abstract
Purpose
This study aimed to assign weights for subscales and items of the Post-Intensive Care Syndrome questionnaire and suggest optimal cut-off values for screening unplanned hospital readmissions of critical care survivors.
Methods
Seventeen experts participated in an analytic hierarchy process for weight assignment. Participants for cut-off analysis were 240 survivors who had been admitted to intensive care units for more than 48 hours in three cities in Korea. We assessed participants using the 18-item Post-Intensive Care Syndrome questionnaire, generated receiver operating characteristic curves, and analysed cut-off values for unplanned readmission based on sensitivity, specificity, and positive likelihood ratios.
Results
Cognitive, physical, and mental subscale weights were 1.13, 0.95, and 0.92, respectively. Incidence of unplanned readmission was 25.4%. Optimal cut-off values were 23.00 for raw scores and 23.73 for weighted scores (total score 54.00), with an area of under the curve (AUC) of .933 and .929, respectively. There was no significant difference in accuracy for original and weighted scores.
Conclusion
The optimal cut-off value accuracy is excellent for screening of unplanned readmissions. We recommend that nurses use the Post-Intensive Care Syndrome Questionnaire to screen for readmission risk or evaluating relevant interventions for critical care survivors.
INTRODUCTION
The focus of critical care outcomes has shifted from survival to long-term functional status and quality of life [1]. Although individual recovery trajectories for critical illness vary, intensive care unit (ICU) survivors often do not return to their previous state for a long period post-discharge [2]. This gap can be described as Post-Intensive Care Syndrome (PICS), referring to cognitive, physical, or mental health problems that develop or worsen related to ICU treatment [3]. Over 50% of ICU survivors experience varying degrees of PICS, and PICS is known to last for many years [4].
As PICS received more research attention, another issue appeared, in that the measures for PICS evaluation were too diverse [5, 6]. A scoping review of 425 studies on ICU survivorship reported that approximately 250 different tools were used to measure post-ICU outcomes [7]. Excessive diversity of tools to measure a variable can hinder the integration of study findings; therefore, standardization of PICS measurement is necessary. Needham et al. [8] proposed a core outcome set using the Delphi technique for assessing PICS in acute respiratory failure survivors. This set comprises existing tools for evaluating physical, mental, and cognitive functions such as the Hospital Anxiety and Depression Scale (HADS), Impact of Event Scale-Revised (IES-R), Montreal Cognitive Assessment (MoCA), 36-Item Short Form Survey (SF-36), and EuroQol-5 Dimension (EQ-5D). However, the types of tools in the core set differ, and the total item number is still large. In addition, even though they were not developed for critically ill patients, they are commonly used in critical care research. This may lead to measurement validity or sensitivity issues.
Contrastingly, a new PICS questionnaire (PICSq) was developed through in-depth interviews and surveys with 536 ICU survivors, and appropriate reliability and validity were reported [9]. Because this tool was developed based on the experience of ICU survivors, it may be more appropriate to assess PICS than other tools. Additionally, the scope of application is wider, because it is targeted at the general ICU population, rather than a specific group of patients. Clinicians can use PICSq scores to screen for PICS in ICU survivors, evaluate intervention effectiveness, or track long-term outcomes [9]. However, PICSq cut-off values for ICU survivor prognosis such as unplanned hospital readmissions have not been investigated. Thus, defined optimal cut-off values will further improve the applicability and usability of the PICSq.
ICU survivorship is associated with significant hospital resource utilization and costs [10, 11]. According to a United Kingdom national data analysis, 81.7% of survivors experienced more than one hospital readmission within five years, of which 54% were unplanned [11]. Unplanned hospital readmissions are an indicator of cost and quality improvements, placing strain on families, society, and individual survivors [12]. Internationally, ICU survivors spend 18,847 to 148,454 US dollars annually on medical expenses [13]. The complex health and psychosocial issues of ICU survivors, namely, PICS, contribute to early readmission after discharge [14]. Experts also noted that early intervention for PICS is important to lower unplanned hospital readmissions [15]. Providing optimal cut-off values for the PICSq for screening patients at high risk of unplanned hospital readmission may help initiate early intervention.
Additionally, since the PICSq is a newly developed tool, expert consensus is needed on whether all items have the same weight. Weights can be imposed through a subjective method of assessing the importance of each item or through a statistical analysis of responses [16]. The analytic hierarchy process (AHP) is a method of mathematically integrating subjective weights. It allows experts to assign relative weights to each item by repeated ranking and comparisons between pairs of items in a tool based on their experience [17]. The AHP compensates for the risk that statistical analysis results may not be consistent with the weights in the real world [18]. Therefore, it is an appropriate method for evaluating the weight of the PICSq, which is still lacking in clinical and research applications. This study aimed to (1) assign AHP weights for the PICSq items and subscales, and (2) suggest optimal cut-off values for raw and weighted PICSq scores for the screening of the unplanned readmission of ICU survivors.
METHODS
1. Study design
This was a methodological study with a cross-sectional design to suggest PICSq cut-off values for screening unplanned readmissions of survivors after ICU discharge.
2. Participants
Participants were survivors who had been discharged home after ICU treatment. Inclusion criteria were ≥ 18 years of age, ICU stay ≥ 48 hours, and < 1 year post-discharge. Exclusion criteria were cognitive impairment before ICU treatment and communication difficulties for the survey. We also excluded survivors who were discharged to rehabilitation or long-term care facilities, because the definition of readmission could be different.
We calculated the sample size in two ways. First, the sample size for PICS comparison between groups was calculated using G*Power 3.1.9.7. The minimum number of participants required for an ANOVA was 231 when the number of groups (categories of variables) was 7, effect size was .25 (medium), significance level was .05, and power was .80. Second, the minimum sample size for ROC curve analysis was 62 (95% confidence interval, power of the study 80% with α error 5%, maximum prediction .70) calculated using MedCalc 19.2.0 statistical software. We adopted the larger of the two sample sizes. We distributed questionnaires to 255 survivors, considering a dropout rate of about 10%, of which 240 were used for final analysis, excluding 15 with missing responses.
3. Measurements
The PICSq, developed by Jeong and Kang [9], is a self-report measure comprising 18 items and three subscales that assess cognitive, physical, and mental impairments. Items are rated using a four-point Likert scale (0 = “never,” 1 = “sometimes,” 2 = “most often,” 3 = “always”). Total scores range between 0 and 54, and subscale scores range between 0 and 18. Higher scores indicate more severe PICS. At the time of development, reliability of the PICSq was Cronbach's α = .94. In the present study Cronbach's α = .92.
Weighted PICS (wPICS) was calculated through the AHP, a process of classifying items into criteria and alternatives, and calculating the importance by comparing them in pairs [18]. In this study, we layered the AHP structure by substituting subscales and items of the PICSq. The standard of sample size required for the AHP is not well known, but the larger the sample, the more difficult it is to ensure the consistency of response [17, 19]. Based on a systematic review that 10~20 experts participated in most AHP studies [17], we recruited 17 critical care or rehabilitation experts, including 11 ICU nurses, an intensivist, two rehabilitation nurses, and three rehabilitation physicians. They assessed relative importance through a pairwise comparison of the PICSq's subscales (cognitive, physical, and mental) and items using a 9-point scale. We calculated the consistency ratio (CR) to evaluate the consistency between each pairwise comparison. If the consistency is perfect, CR = 0, and usually CR < .2 is an acceptable level [17, 20, 21]. In this study, the criteria for consistency were satisfied with CR = .05 to .16 for each item. We input the responses of 17 experts into Expert Choice software (Expert Choice Riskion®, Arlington, Virginia) to calculate the weights of the three subscales and 18 items of the PICSq.
Additionally, hospital readmission was one of the survey items, and each participant responded directly. It was explained to the participants that planned readmission (i.e., for chemotherapy or rehabilitation) should be excluded. They were asked to respond only with regard to unplanned readmissions after hospital discharge.
4. Procedure
We conducted a survey from November 19, 2018 to June 28, 2019. Participants were publicly recruited by posting notices on bulletin boards in outpatient clinics at four tertiary hospitals located in three cities in Korea. When an ICU survivor indicated willingness to participate, research assistants reviewed whether the person met selection criteria. Selected participants completed the survey in designated meeting rooms, which took about five minutes.
5. Ethical considerations
The Dong-A University Institutional Review Board approved this study (2-1040709-AB-N-01-201810-HR-031-02, 2-10407 09-AB-N-01-201810-HR-031-03). All participants provided written consent after being informed of the study's purpose and methods.
6. Statistical analysis
Data were analysed using IBM SPSS 25.0 (IBM Corp., Armonk, NY) and MedCalc 19.2.0 (MedCalc Software, Mariakerke, Belgium). Participant demographics and ICU characteristics were analysed by calculating descriptive statistics such as frequency, percentage, mean, and standard deviation. PICSq mean differences according to participant characteristics were analysed by independent sample t-test and ANOVA. The scheffe test was used a post-hoc test. Differences in participant characteristics depending on whether or not there was an unplanned readmission were analysed by the chi-square test and independent sample t-test.
We generated Receiver Operating Characteristics (ROC) curves to identify changes in sensitivity and specificity at each cut-off value for unplanned readmission. Optimal cut-off values for PICSq and wPICS scores were presented considering positive likelihood ratio (LR) as well as sensitivity and specificity. In general, a value with high sensitivity and specificity is selected as the cut-off score [22]. However, there is a limitation that sensitivity and specificity are affected by the prevalence. In order to compensate for this, the positive likelihood ratio, which is not related to the prevalence, should also be considered when determining the cut-off score [23]. Based on the opinions that a LR of less than 3 is not useful for clinical decisions [24, 25], we selected scores with a LR of 3 or more while having both high sensitivity and specificity as the optimal cut-off values. Accuracy differences between PICSq and wPICS cut-off values were analysed by the z-test for area under the ROC curve (AUC).
RESULTS
1. Weights of subscales and items
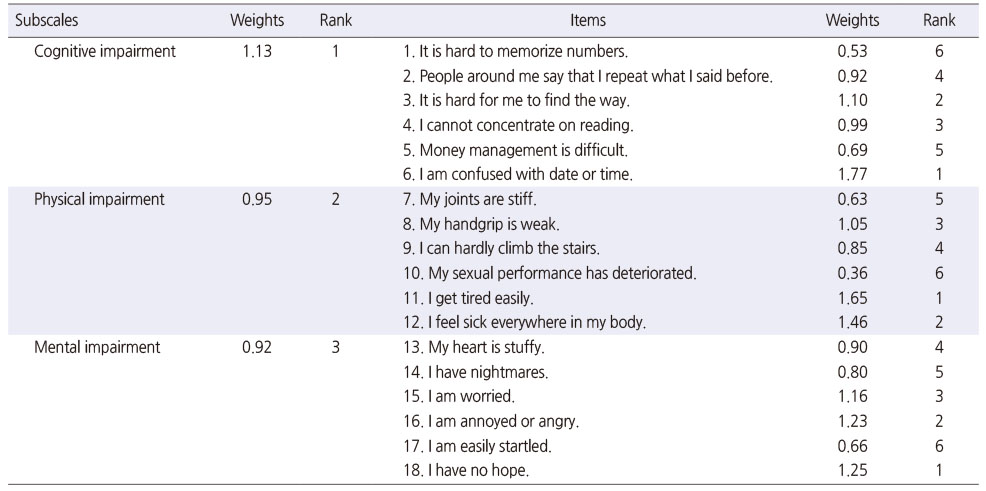
Table 1 shows the weights of the three subscales and 18 items of the questionnaire calculated via AHP. The expert group weighted the highest on the cognitive subscale and lowest on the mental subscale. On the cognitive subscale, the item with the highest weight was “I am confused with date or time,” and the lowest item was “It's hard to memorize numbers.” The item with the highest weight on the physical subscale was “I get tired easily,” and the item with the lowest weight was “My sexual performance has deteriorated.” For the mental subscale, “I have no hope” had the highest weight, and “I am easily startled” had the lowest weight.
Table 1
Weights of Post Intensive Care Syndrome Questionnaire Subscales and Items
The formula for calculating wPICS was as follows:
2. Participant characteristics and post-intensive care syndrome
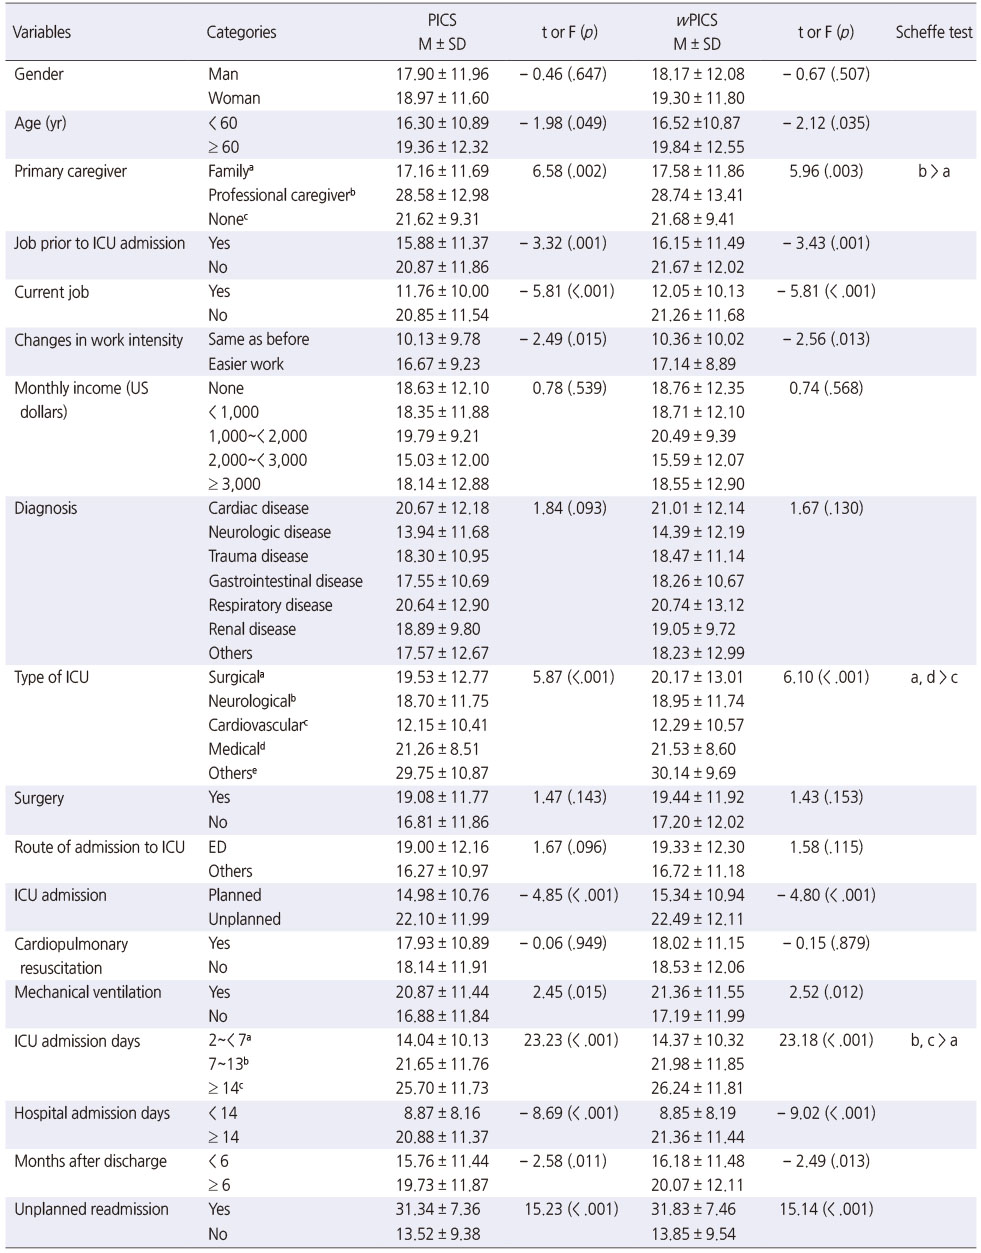
Of the 240 participants, the mean age was 61.4 ± 14.54 years, and 70.8% were male. The majority (86.3%) of primary caregivers were families. Before ICU admission, 45.0% of the participants were unemployed; however, 70.0% were unemployed post-discharge. Monthly household income of most participants (79.6%) was less than 3,000 US dollars.
Participants' diagnostic categories were cardiovascular (25.4%), neurologic (21.7%), and gastrointestinal diseases (12.1%). They were admitted to surgical (35.8%), neurologic (23.8%), and medical ICUs (16.3%). More than half (57.9%) had surgery, and 67.9% were admitted via emergency rooms. About half (55.8%) of ICU admissions were planned. Among the participants, 5.8% received CPR and 31.3% were on mechanical ventilation. The mean number of ICU days was 8.38 ± 9.19, and mean number of hospital admission days was 36.10 ± 31.16. The mean number of months post-discharge was 6.82 ± 4.06. About one-fourth (25.8%) had experienced unplanned readmissions (Table 2).
Table 2
Participants' Characteristics and Post-Intensive Care Syndrome (N = 240)
The mean PICSq raw score was 18.13 ± 11.84. Mean PICSq scores were significantly higher in the following groups: ≥ 60 years old (t = − 1.98, p = .049), professional caregiver service (F = 6.58, p = .002), previous unemployment (t = − 3.32, p = .001), current unemployment (t = − 5.81, p < .001), changes in workload (t = − 2.49, p = .015), admitted to medical or surgical ICU (F = 5.87, p < .001), unplanned ICU admission (t = − 4.85, p < .001), mechanical ventilation (t = 2.45, p = .015), ≥ 14 ICU days (F = 23.23, p < .001), ≥ 14 hospital days (t = − 8.69, p < .001), ≥ 6 months post-discharge (t = − 2.58, p = .011), and unplanned readmission (t = 15.23, p < .001).
Mean wPICS score was 18.50 ± 12.00, and the differences in mean wPICS scores according to participant characteristics were similar to the raw score analysis (Table 2).
3. Optimal cut-off values for unplanned hospital readmission
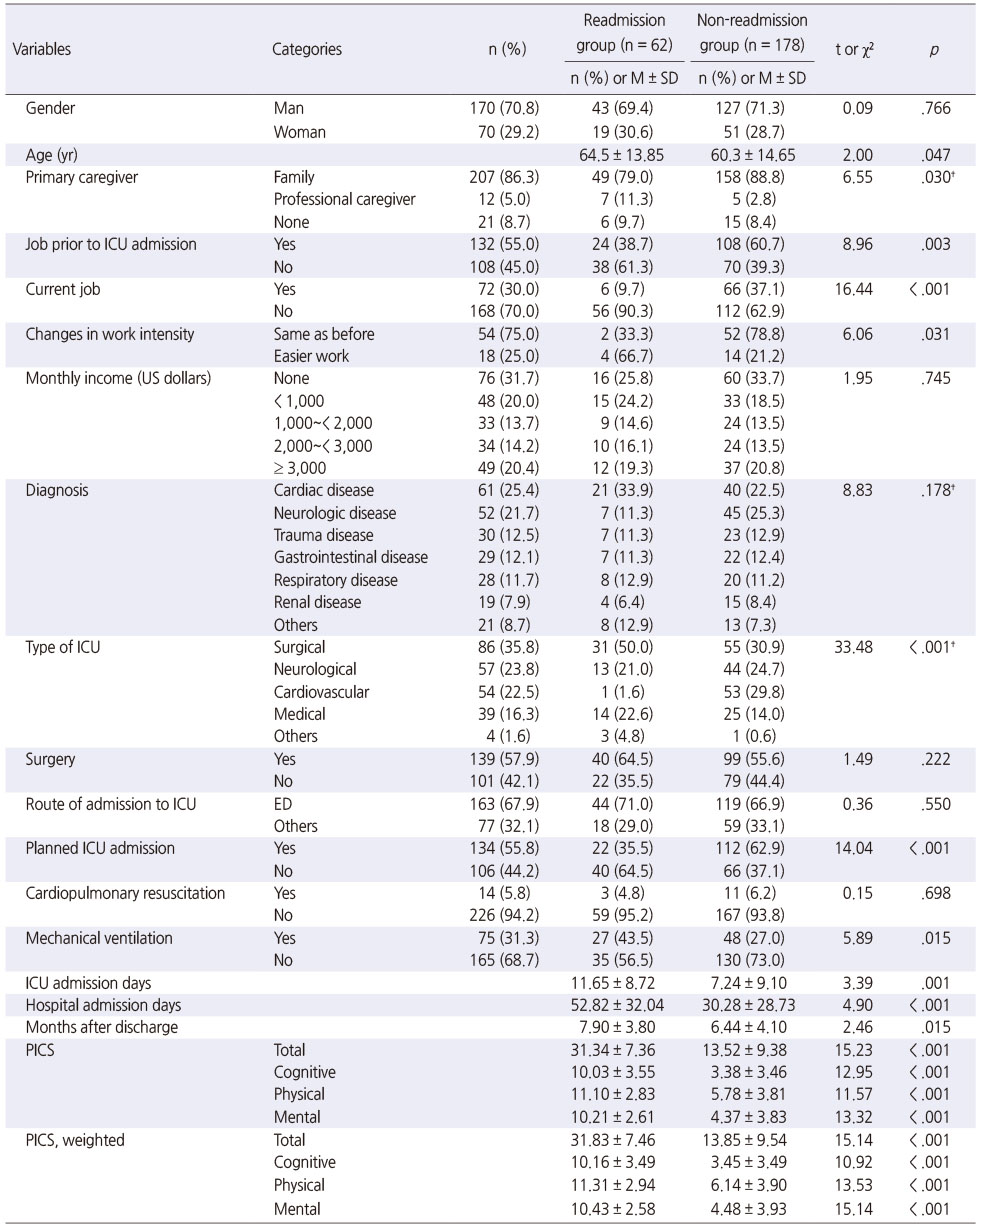
Unplanned hospital readmission incidence within a year was 25.8%; Table 3 shows differences in participant characteristics according to unplanned readmission. Raw and weighted total and subscale scores for the PICSq in the readmission group were significantly higher than those of the non-readmission group.
Table 3
Participants' Characteristics by Unplanned Hospital Readmission (N = 240)
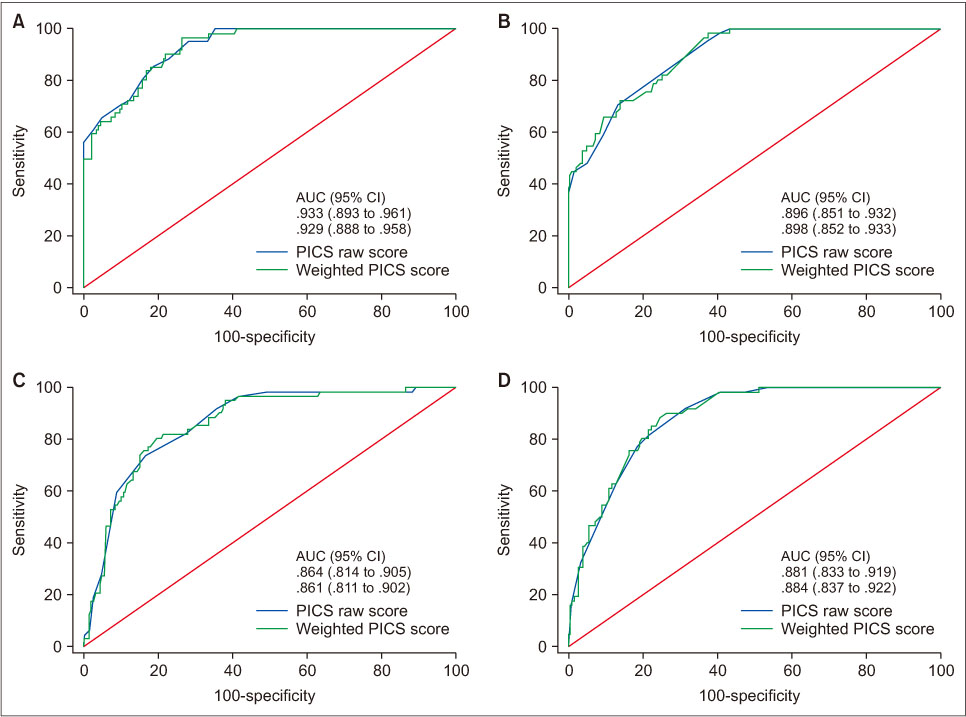
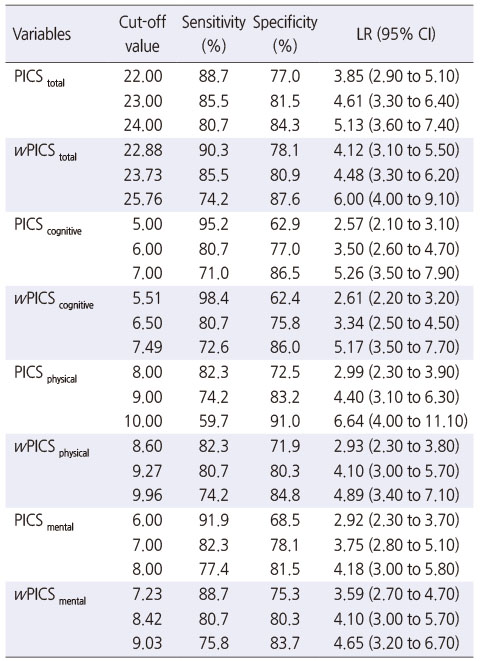
Figure 1 and Table 4 show the cut-off values of PICSq raw and weighted scores to screen the unplanned readmission of ICU survivors. Optimal cut-off values, considering sensitivity, specificity, and positive LR, were 23.0, 6.0, 9.0, and 7.0 for PICStotal, PICScognitive, PICSphysical, and PICSmental, respectively (Table 4). Sensitivity, specificity, positive LR, and AUC at the cut-off value of 23.0 for PICStotal were 85.5%, 81.5%, 4.61, and .933, respectively. Additionally, we suggested optimal cut-off values of 23.73 for wPICStotal, 6.50 for wPICScognitive, 9.27 for wPICSphysical, and 8.42 for wPICSmental. The sensitivity, specificity, positive LR, and AUC for the cut-off value of 23.73 wPICStotal were 85.5%, 80.9%, 4.48, and .929, respectively. There was no statistically significant difference between AUCs of raw and weighted scores (Supplementary data).
Figure 1
AUC comparison of PICS raw and weighted scores (A: PICS total, B: PICS cognitive, C: PICS physical, D: PICS mental).
Table 4
Cut-Off Values for Unplanned Hospital Readmission (N = 240)
DISCUSSION
We analysed AHP weights and cut-off values for each subscale and item to validate the PICSq, a measure of PICS in ICU survivors. The optimal cut-off values for screening unplanned readmissions of ICU survivors were 23.00 for the raw score and 23.73 for the weighted score, with AUCs of .933 and .929, respectively, corresponding to excellent accuracy [23]. There was no difference in accuracy between cut-off values for raw and weighted scores; thus, it may not be necessary to use weighted scores when assessing PICS. The AHP is a multi-criteria decision-making method in which experts assign weights through pairwise comparisons between items in each category [17, 26]. Therefore, the weights in this study could be used by healthcare professionals to determine priorities of the needs or preferences of survivors.
The highest weight was assigned to the cognitive subscale of the PICSq. This can be interpreted that critical care experts perceive cognitive impairment as the most important factor of PICS. In addition, it is consistent with previous studies that reported that cognitive impairment experienced by critical care survivors had a higher incidence and longer duration than other areas of PICS [27, 28, 29]. The major risk factor for cognitive impairment is known as delirium [30], so ICU medical staff apply various interventions to prevent delirium. Recently, the use of ABCDEF Bundle has been recommended [31]. It has been reported that periodic assessment of consciousness and the use of appropriate analgesic and sedatives can reduce delirium [32].
Our expert AHP placed a high weight on items that differed from existing measurement tools commonly used (i.g., MoCA, HADS, measures of activities of daily living [ADL]). For example, the cognitive subscale item with the highest weight was “I am confused with date or time.” This item could be more comprehensive and consistent than the items of the MoCA [8], which is recommended as a post-ICU cognitive evaluation tool, and gives 1 point each for orientation to the current year, month, and date. Most previous studies evaluated survivors' physical impairment using a 6-Minuite Walk Test (6MWT) or assessing ADL [7]. Unlike these, in our study, the item with the highest weight on the physical subscale was “I get tired easily,” corresponding to a symptom survivors experience. The item with the highest weight on the mental subscale, “I have no hope,” is also missing on the HADS, which experts recommend most to measure survivors' anxiety and depression [8]. The cause of these differences may be that the MoCA, ADL assessments, and HADS were not developed for ICU survivors. The weights in this study, along with the PICSq based on ICU survivors' experiences, can help to more appropriately assess survivors' cognitive, physical, and mental health.
Optimal cut-off values for measurement tools need to be determined by considering not only statistical accuracy but also clinical significance and usefulness [23]. In this study, sensitivity and specificity of 23.00 and 23.73 points, respectively, suggested optimal PICStotal and wPICStotal cut-off values were 80.9~85.5%. If we had raised cut-off values, sensitivity could have been higher than 90%; however, specificity would have been lowered to 70%. We determined the optimal cut-off values by considering positive LR, which is the ratio of those who did and did not readmit among survivors above the cut-off. The high sensitivity of the PICSq can make it easier to identify survivors who are at-risk for re-admission, allowing for measures to be taken to reduce clinical and financial burdens [33]. However, we should also pay attention to the relatively low LR of our cut-off values. LR is the best indicator for ruling-in diagnoses, and the criteria for good diagnostic tests is LR > 10 [23]. Compared to the sensitivity, LR is related to the usefulness of diagnostic tests [33]; thus, our findings suggested that the practical usefulness of the PICSq may be low. However, the PICSq is not a diagnostic test, rather it is a screening tool. It is a self-report measure that is free, non-invasive, and requires minimal time and effort. Therefore, low LR is unlikely to interfere with clinical use of the PICSq.
Healthcare providers can use our cut-off values to identify survivors likely to be readmitted and provide them with appropriate interventions. A quarter of our survivors reported unplanned readmissions at the time of the survey. We excluded planned hospitalization, such as chemotherapy or rehabilitation; therefore, readmission incidence appears lower than 70%, as reported in a previous study [34]. Until 12 months post-discharge, ICU survivors' physical and mental health is at low levels and recovers slowly [35]. According to a relevant qualitative study [36], readmission breaks the trajectory of post-ICU recovery. Therefore, it is important to proactively assess unplanned readmission risk and provide appropriate interventions.
One intervention for ICU survivors is post-ICU clinics [27, 37]. In post-ICU clinics, the 6MWT, MoCA, HADS, and assessment of ADL have been used for screenings and follow-up evaluations of survivors [38]. Using the PICSq cut-off values instead of these measures, which require space and assessor training, will increase the effectiveness of screenings, evaluations of interventions, and follow-up management. Specifically, using the cut-off values, nurses can easily screen PICS risk and help provide timely interventions to survivors in need. In addition, cut-off values can be used to evaluate various interventions such as therapeutic communication, family support, and the ICU diary provided for PICS prevention or reduction [39]. Because unplanned hospital readmission is a major long-term outcome indicator of critical care [15, 40], our cut-off values could also contribute to the evaluation and improvement of medical treatment and nursing care in the ICU. Additionally, PICS affects cognitive, physical, and mental health, and survivors may experience impairments in some or all areas [29]. We proposed the cut-off values for each subscale, as well as the PICSq total score, to provide a basis for more individualized assessments and interventions for PICS.
This study is meaningful in that it increased the usability of the PICSq by presenting cut-off values for the risk of unplanned readmission of ICU survivors. We proposed more valid cut-off values for screening hospital readmissions, for which various prevalence rates have been reported for different populations, by considering positive LR, as well as sensitivity and specificity. It is expected that our cut-off values for raw and weighted scores can be used for PICS screenings and intervention evaluations.
This study has some limitations. First, because participants were recruited voluntarily, survivors in relatively poor health would have been excluded. Thus, it is possible that overall PICS and readmission rates were underestimated. Second, participants self-reported their planned/unplanned hospital readmissions, and the accuracy of the reports cannot be guaranteed. In future studies, it is necessary to evaluate readmission by objective methods such as reviewing the participant's medical record. In addition, it is necessary to re-analyze the accuracy of the cut-off values by conducting a prospective study from the time the patient transferred from the ICU to the general inpatient unit. Third, this study was conducted at four university hospitals in three cities in Korea and did not include survivors who could not be discharged from the hospital after the ICU treatment or who had been transferred to other hospitals. Therefore, there may be limitations on the generalization of study results. As measurement accuracy is population dependent [23], repeated studies with different post-intensive care populations and settings are needed.
CONCLUSION
We calculated the weights of PICSq subscales and items through an expert group AHP, and suggested cut-off values for raw and weighted scores for unplanned readmission risk. The optimal cut-off values considering sensitivity, specificity, and positive LR were 23.00 for the raw score and 23.73 for the weighted score, with AUCs of .933 and .929, respectively, corresponding to excellent accuracy. Based on these findings, we recommend healthcare providers use the PICSq to screen for the risk of unplanned readmission and evaluate relevant interventions for ICU survivors.
SUPPLEMENTARY DATA
Supplementary data to this article can be found online at https://doi.org/10.4040/jkan.20233.
Differences between AUCs of the Raw and Weighted Cut-off Values (N = 240)Table 1
This work was presented at 2020 Korean Society of Nursing Science Conference, October, 2020, Seoul, South Korea.
CONFLICTS OF INTEREST:The authors declared no conflict of interest.
FUNDING:This research was supported by Basic Science Research Program through the National Research Foundation of Korea (NRF) funded by the Ministry of Education (NRF-2016R1D1A1B03936044) and Korea government (MSIT) (No. NRF-2019R1A2C1011300).
AUTHOR CONTRIBUTIONS:
Conceptualization or/and Methodology: Kang J.
Data curation or/and Analysis: Hong J.
Funding acquisition: Kang J.
Investigation: Jeong YJ.
Project administration or/and Supervision: Kang J.
Resources or/and Software: Hong J.
Validation: Kang J & Jeong YJ & Hong J.
Visualization: Hong J.
Writing original draft or/and Review & editing: Kang J & Jeong YJ & Hong J.
ACKNOWLEDGEMENTS
None.
DATA SHARING STATEMENT
Please contact the corresponding author for data availability.
References
-
Kress JP, Hall JB. ICU-acquired weakness and recovery from critical illness. New England Journal of Medicine 2014;370(17):1626–1635. [doi: 10.1056/NEJMra1209390]
-
-
Mikkelsen ME, Netzer G, Iwashyna T. Post-intensive care syndrome (PICS) [Internet]. Waltham (MA): UpToDate, Inc; c2019 [cited 2020 Nov 16].Available from: http://www.uptodate.com/contents/post-
intensive- care- syndrome- pics.
-
-
Needham DM, Sepulveda KA, Dinglas VD, Chessare CM, Friedman LA, Bingham CO 3rd, et al. Core outcome measures for clinical research in acute respiratory failure survivors. An international modified Delphi consensus study. American Journal of Respiratory and Critical Care Medicine. 2017;196(9):1122–1130. [doi: 10.1164/rccm.201702-0372OC]
-
-
Donaghy E, Salisbury L, Lone NI, Lee R, Ramsey P, Rattray JE, et al. Unplanned early hospital readmission among critical care survivors: A mixed methods study of patients and carers. BMJ Quality & Safety 2018;27(11):915–927. [doi: 10.1136/bmjqs-2017-007513]
-
-
Brown SM, Bose S, Banner-Goodspeed V, Beesley SJ, Dinglas VD, Hopkins RO, et al. Approaches to addressing post-intensive care syndrome among intensive care unit survivors. A narrative review. Annals of the American Thoracic Society. 2019;16(8):947–956. [doi: 10.1513/AnnalsATS.201812-913FR]
-
-
Koksalmis E, Kabak Ö. Deriving decision makers' weights in group decision making: An overview of objective methods. Information Fusion 2019;49:146–160. [doi: 10.1016/j.inffus.2018.11.009]
-
-
Saaty TL. Decision making with the analytic hierarchy process. International Journal of Services Sciences 2008;1(1):83–98.
-
-
Waris M, Panigrahi S, Mengal A, Soomro MI, Mirjat NH, Ullah M, et al. An application of analytic hierarchy process (AHP) for sustainable procurement of construction equipment: Multicriteria-based decision framework for Malaysia. Mathematical Problems in Engineering 2019;2019:6391431. [doi: 10.1155/2019/6391431]
-
-
Song SW. Using the receiver operating characteristic (ROC) curve to measure sensitivity and specificity. Korean Journal of Family Medicine 2009;30(11):841–842. [doi: 10.4082/kjfm.2009.30.11.841]
-
-
Šimundić AM. Measures of diagnostic accuracy: Basic definitions. EJIFCC 2009;19(4):203–211.
-
-
Devlin JW, Skrobik Y, Gélinas C, Needham DM, Slooter AJC, Pandharipande PP, et al. Clinical practice guidelines for the prevention and management of pain, agitation/sedation, delirium, immobility, and sleep disruption in adult patients in the ICU. Critical Care Medicine 2018;46(9):e825–e873. [doi: 10.1097/CCM.0000000000003299]
-
-
Inoue S, Hatakeyama J, Kondo Y, Hifumi T, Sakuramoto H, Kawasaki T, et al. Post-intensive care syndrome: Its pathophysiology, prevention, and future directions. Acute Medicine & Surgery 2019;6(3):233–246. [doi: 10.1002/ams2.415]
-
 KSNS
KSNS
 E-SUBMISSION

 Cite
Cite

