 E-SUBMISSION
Articles
- Page Path
- HOME > J Korean Acad Nurs > Volume 43(2); 2013 > Article
-
Original Article
- An Introduction to Logistic Regression: From Basic Concepts to Interpretation with Particular Attention to Nursing Domain
- Hyeoun-Ae Park
-
Journal of Korean Academy of Nursing 2013;43(2):154-164.
DOI: https://doi.org/10.4040/jkan.2013.43.2.154
Published online: April 30, 2013
College of Nursing and System Biomedical Informatics National Core Research Center, Seoul National University, Seoul, Korea.
- Address reprint requests to: Park, Hyeoun-Ae. College of Nursing, Seoul National University, 103 Daehak-ro, Jongno-gu, Seoul 110-799, Korea. Tel: +82-10-3786-3284, Fax: +82-2-765-4103, hapark@snu.ac.kr
• Received: March 19, 2013 • Accepted: April 2, 2013
© 2013 Korean Society of Nursing Science
- Abstract
- INTRODUCTION
- CONCEPTS RELATED TO LOGISTIC REGRESSION
- ASSUMPTIONS OF LOGISTIC REGRESSION
- STUDY DESIGN OF LOGISTIC REGRESSION
- SAMPLE SIZE FOR LOGISTIC REGRESSION
- FITTING THE LOGISTIC REGRESSION MODEL
- EVALUATION OF A LOGISTIC REGRESSION MODEL
- REPORTING AND INTERPRETING LOGISTIC REGRESSION RESULTS
- CAUTIONS AND CONSIDERATIONS
- ANALYSIS OF USE OF LOGISTIC REGRESSION IN NURSING
- CONCLUSION
- REFERENCES
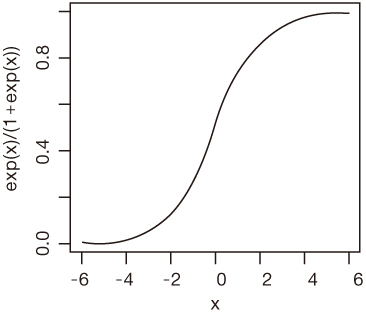
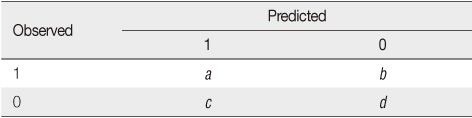
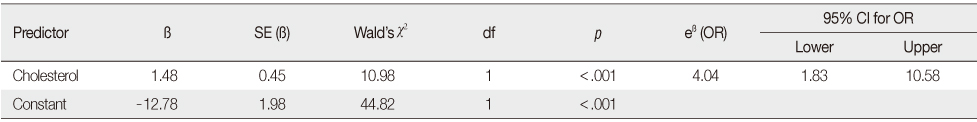
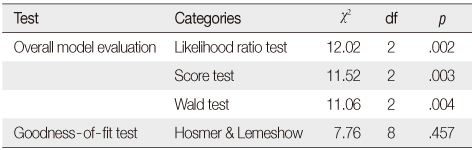
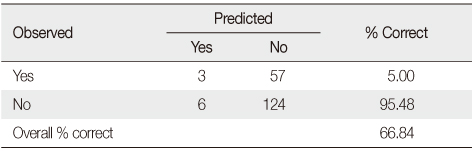

Figure & Data
REFERENCES
Citations
Citations to this article as recorded by 
- Examining the effect of farm and farmers' characteristics and input allocation on potato production
Ardi Rumallang, Muslim Salam, Letty Fudjaja, Pipi Diansari, Baharuddin Patandjengi, Rahim Darma, A. Nixia Tenriawaru, Heliawaty, Akhsan, Rahmadanih, Rida Akzar, Muhammad Ridwan, Hamed Noralla Bakheet Ali
Frontiers in Sustainable Food Systems.2026;[Epub] CrossRef - Assessing landslide susceptibility mapping in the Sikkim Himalayas using an ensemble machine learning approach
Indrajit Poddar, Ranjan Roy
Discover Geoscience.2026;[Epub] CrossRef - Machine learning & geospatial approach for analysing the groundwater quality of J&K region, NW Himalaya
Avtar Singh Jasrotia, Amit Sharma, Mohinder Lal Angurala, Komal Kumar Singh, Upasna Andotra, Rajesh Kumar
Evolving Earth.2026; 4: 100118. CrossRef - The association of caries prevalence and experience in relation with molar incisor hypomineralisation and its associated factors in Mexican schoolchildren: a cross-sectional study
M. Rivera, L. Karakowsky, C. E. Medina-Solís, A. P. Pontigo-Loyola, D. J. Manton
European Archives of Paediatric Dentistry.2026;[Epub] CrossRef - OMICS data in the diagnosis of diabetic retinopathy: A comparison between transcriptome data and DNA methylation data
Pratheeba Jeyananthan, H.V.B.L. Chandrasiri, A.G.F. Ashfa
Experimental Eye Research.2026; 267: 110988. CrossRef - Cumulative effect of cotrimoxazole, isoniazid and opportunistic infection prophylaxis on CD4 response among people living with HIV on first-line ART in Ari Zone, Southern Ethiopia
Sitotaw Ahmed, Tegenu Tento, Nurhussen Ahmed
AIDS Research and Therapy.2026;[Epub] CrossRef - Sociodemographic Characteristics of Internationally Educated Nurses Associated With Successful Outcomes in Canada: Quantitative Analysis
Nasrin Alostaz, Jiajie Mo, Margaret Walton‐Roberts, Ruth Chen, Maria Pratt, Olive Wahoush
Journal of Advanced Nursing.2025; 81(7): 3753. CrossRef - The development of classification-based machine-learning models for the toxicity assessment of chemicals associated with plastic packaging
Md Mobarak Hossain, Kunal Roy
Journal of Hazardous Materials.2025; 484: 136702. CrossRef - Development of a predictive model for severe peripartum hemorrhage in placenta accreta spectrum cases under neuraxial anesthesia: a multicenter retrospective analysis
Yanan Li, Liang Li, Xiao Song, Fanqing Meng, Meiling Zhang, Yarong Li, Ran Chu
Therapeutic Advances in Reproductive Health.2025;[Epub] CrossRef - Innovative Credit Risk Assessment: Leveraging Social Media Data for Inclusive Credit Scoring in Indonesia’s Fintech Sector
Andry Alamsyah, Aufa Azhari Hafidh, Annisa Dwiyanti Mulya
Journal of Risk and Financial Management.2025; 18(2): 74. CrossRef - Machine Learning as a Tool for Assessment and Management of Fraud Risk in Banking Transactions
Antonio Dichev, Silvia Zarkova, Petko Angelov
Journal of Risk and Financial Management.2025; 18(3): 130. CrossRef - MLP-SVM: a hybrid approach for improving the performance of the classification model for health-related documents from social media using multi-layer perceptron and support vector machine
Etana Fikadu, Teklu Urgessa, Mrinal Das
Discover Applied Sciences.2025;[Epub] CrossRef - Armed conflict and household food insecurity: impacts and coping strategies in the conflict-affected rural settings of Tigray, Ethiopia
Hafte Gebreselassie Gebrihet, Yibrah Hagos Gebresilassie
Cogent Social Sciences.2025;[Epub] CrossRef - Employing Binary Logistic Regression in Modeling the Effectiveness of Agricultural Extension in Clove Farming: Facts and Findings from Sidrap Regency, Indonesia
Hasim Hasim, Muslim Salam, Andi Amran Sulaiman, Muhammad Hatta Jamil, Hari Iswoyo, Pipi Diansari, Ariady Arsal, Andi Nixia Tenriawaru, Akhsan Akhsan, Ahmad Imam Muslim
Sustainability.2025; 17(6): 2786. CrossRef - Harnessing Socio-Spatial Dynamics for Pandemic Resilience: Evidence from Kozhikode, India
Shahana Usman Abdulla, Bimal Puthuvayi
One Health.2025; 20: 101052. CrossRef - A supervised learning approach for recommending medical specialists in the healthcare sector for the Afaan Oromo context
Etana Fikadu, Mrinal Das, Teklu Urgessa, Krishnaraj Ramaswamy
Discover Computing.2025;[Epub] CrossRef - Machine Learning-Based Ensemble Feature Selection and Nested Cross-Validation for miRNA Biomarker Discovery in Usher Syndrome
Rama Krishna Thelagathoti, Dinesh S. Chandel, Wesley A. Tom, Chao Jiang, Gary Krzyzanowski, Appolinaire Olou, M. Rohan Fernando
Bioengineering.2025; 12(5): 497. CrossRef - Unmooring tax compliance: The impact of information technology in the Zimbabwean small firms under presumptive taxation
Munyaradzi Duve, Daniel P. Schutte
Social Sciences & Humanities Open.2025; 11: 101422. CrossRef - Is Video Assistant Referee (VAR) a disadvantage for the strong and a protection for the weak? The case of Turkish Super League
Ümit Kuvvetli, Esin Firuzan, Ali Riza Firuzan
Psychology of Sport and Exercise.2025; 80: 102924. CrossRef - Factores que motivan la intención emprendedora de los estudiantes universitarios: caso Universidad Técnica de Machala
Julio César Cacay Cacay, Lenny Beatriz Capa Benítez
LATAM Revista Latinoamericana de Ciencias Sociales y Humanidades.2025;[Epub] CrossRef - Machine learning techniques for stroke prediction: A systematic review of algorithms, datasets, and regional gaps
Afeez Adekunle Soladoye, Nicholas Aderinto, Mayowa Racheal Popoola, Ibrahim A. Adeyanju, Ayokunle Osonuga, David B. Olawade
International Journal of Medical Informatics.2025; 203: 106041. CrossRef - A Machine Learning Approach to the Prediction of Malaria in Under-five Children: Analysis of the 2021 Nigerian Malaria Indicator Survey
Sbongiseni Makhosonke Mthethwa, Sileshi Fanta Melesse
The Open Public Health Journal.2025;[Epub] CrossRef - Modelling of biological age in stable and acute exacerbations of chronic obstructive pulmonary disease
Yujiao Wang, Ting Mu, Yufen Fu, Yuxin Wang, Guoping Li
BMC Pulmonary Medicine.2025;[Epub] CrossRef - Factors influencing undernutrition among children in Nepal: a comparative study of Composite Index of Anthropometric Failure (CIAF) using 2016 and 2022 demographic and health survey data
Ram Prasad Dhakal, Vijay Aryal, Pitambar Acharya
Journal of Health, Population and Nutrition.2025;[Epub] CrossRef - Assessing the Impact of Infrastructure and Social Environment Predictors on Road Accidents in Switzerland Using Machine Learning Algorithms and Open Large-Scale Dataset
Alessandro Auzzas, Gian Franco Capra, Antonio Ganga
Urban Science.2025; 9(9): 343. CrossRef - Drivers of Integrated Soil Fertility Management Adoption Among Smallholder Farmers in Bure District, Ethiopia
Solomon Tadesse, Tekalign Assefa, Wafaa M. Abd El Rahim
Applied and Environmental Soil Science.2025;[Epub] CrossRef - Career paths and university education: factors that determine the employment status of university graduates
Heily Consepción Portocarrero Ramos, Jonathan Alberto Campos Trigoso, Omer Cruz Caro, Yuri Reina Marín, Jorge Luis Maicelo Guevara, Einstein Sánchez Bardales, River Chávez Santos
Frontiers in Education.2025;[Epub] CrossRef - Assessment of Prevalence and Determinants Associated with Hypertension Among the Adult Population in Hawtat Bani Tamim Province
Mohammed Omar Musa Mohammed, Ahmed Saied Rahama Abdallah
International Journal of Environmental Research and Public Health.2025; 22(10): 1467. CrossRef - Deep learning techniques used for the detection of fraudulent activities within the ethereum network
Khalid Alkhatib, Fares Al Ayoub, Qais Marji
Cluster Computing.2025;[Epub] CrossRef - Examining the prevalence of and factors associated with facility-based birth services in Bangladesh: a cross-sectional analysis using national data
Sanjoy Kumar Chanda, Meherab Hossain, Ashik Mondal, Antora Rahut, Md. Mehedi Hasan, Md. Shariful Islam
Discover Public Health.2025;[Epub] CrossRef - Nurses' Self‐Perceived Patient Safety Competencies: Associations With Work‐ and Education‐Related Factors in a Cross‐Sectional Study
Liisi Mägi, Kaja Põlluste, Margus Lember, Mariliis Põld, Mari Kangasniemi
Journal of Advanced Nursing.2025;[Epub] CrossRef - Effective pulse shape discrimination for neutron and gamma-ray radiation using wavelet transform and logistic regression
Assem Abdelhakim, Ehab Elshazly, M.E. Hammad
Journal of Instrumentation.2025; 20(12): P12003. CrossRef - A comparative evaluation of machine learning classification models utilizing GIS and key flood-causing factors for enhancing flood vulnerability assessment
Ahmed E. M. Al-Juaidi, Osman Taylan, Huseyin Toros
Environment, Development and Sustainability.2025;[Epub] CrossRef - Landslide Occurrence and Mitigation Strategies: Exploring Community Perception in Kivu Catchment of Rwanda
Ma-Lyse Nema, Bachir Mahaman Saley, Arona Diedhiou, Assiel Mugabe
GeoHazards.2025; 7(1): 1. CrossRef - Informatics and measurement in healthcare: deep learning for diabetic patient readmission prediction
Shiva Saffari, Mahdi Bahaghighat
Informatyka, Automatyka, Pomiary w Gospodarce i Ochronie Środowiska.2025; 15(4): 56. CrossRef - Longitudinal Risk Analysis of Second Primary Cancer after Curative Treatment in Patients with Rectal Cancer
Jiun-Yi Hsia, Chi-Chang Chang, Chung-Feng Liu, Chia-Lin Chou, Ching-Chieh Yang
Diagnostics.2024; 14(13): 1461. CrossRef - MODELLING THE FACTORS AFFECTING CRASH OCCURRENCE AND FREQUENCY RESULTED FROM MOBILE PHONE USE WHILE DRIVING: EVIDENCE FROM AL-NAJAF, IRAQ
Firas Asad, Shaimaa Hadi
Kufa Journal of Engineering.2024; 15(2): 74. CrossRef - Factors That Affect Rural Financial Inclusion: A Case of Gambella Town, Gambell Peoples National Regional State, Ethiopia
Chuol Jock Ruey
KnE Social Sciences.2024;[Epub] CrossRef - Learning strategies, self-efficacy beliefs and academic achievement of first-year preservice teachers: a person-centred approach
Henna Vilppu, Eero Laakkonen, Anu Laine, Marko Lähteenmäki, Riitta-Leena Metsäpelto, Mirjamaija Mikkilä-Erdmann, Anu Warinowski
European Journal of Psychology of Education.2024; 39(2): 1161. CrossRef - Landscape dynamics and its related factors in the Citarum River Basin: a comparison of three algorithms with multivariate analysis
Moh. Dede, Sunardi Sunardi, Kuok-Choy Lam, Susanti Withaningsih, Hendarmawan Hendarmawan, Teguh Husodo
Geocarto International.2024;[Epub] CrossRef - Analysis in Terms of Environmental Awareness of Farmers’ Decisions and Attitudes: Reducing Pesticide Use and Risks
Ismail Bulent Gurbuz
Sustainability.2024; 16(11): 4323. CrossRef - Assessment of pedestrians’ red light violation behavior at signalized crosswalks in Kathmandu, Nepal
Deepak Raj Shah, Rojee Pradhananga
Transportation Research Interdisciplinary Perspectives.2024; 24: 101035. CrossRef - Financial Stress, Family, Marital, and Life Satisfaction of Turkish Families During Covid-19: What Did We Learn?
Selda Coşkuner Aktaş, Birgül Çiçek
Journal of Family Issues.2024; 45(4): 1044. CrossRef - Logistic regression and other statistical tools in diagnostic biomarker studies
Dina Mohamed Ahmed Samir Elkahwagy, Caroline Joseph Kiriacos, Manar Mansour
Clinical and Translational Oncology.2024; 26(9): 2172. CrossRef - Machine learning applications in vadose zone hydrology: A review
Xiang Li, John L. Nieber, Vipin Kumar
Vadose Zone Journal.2024;[Epub] CrossRef - Improving dengue fever predictions in Taiwan based on feature selection and random forests
Chao-Yang Kuo, Wei-Wen Yang, Emily Chia-Yu Su
BMC Infectious Diseases.2024;[Epub] CrossRef - A logit model approach to the examination of parents’ willingness to contribute towards the cost of senior high school education: The case of parents in Tamale, Ghana
William Kofi Nkegbe
Social Sciences & Humanities Open.2024; 9: 100832. CrossRef - PET radiomics-based lymphovascular invasion prediction in lung cancer using multiple segmentation and multi-machine learning algorithms
Seyyed Ali Hosseini, Ghasem Hajianfar, Pardis Ghaffarian, Milad Seyfi, Elahe Hosseini, Atlas Haddadi Aval, Stijn Servaes, Mauro Hanaoka, Pedro Rosa-Neto, Sanjeev Chawla, Habib Zaidi, Mohammad Reza Ay
Physical and Engineering Sciences in Medicine.2024; 47(4): 1613. CrossRef - Boosting Institutional Identity on X Using NLP and Sentiment Analysis: King Faisal University as a Case Study
Khalied M. Albarrak, Shaymaa E. Sorour
Mathematics.2024; 12(12): 1806. CrossRef - Faktor-Faktor yang Mempengaruhi Hasil Belajar Statistika Mahasiswa melalui Pemodelan Regresi Logistik Biner
Filda Febrinita, Wahid Ibnu Zaman, Wahyu Dwi Puspitasari
Kognitif: Jurnal Riset HOTS Pendidikan Matematika.2024; 4(1): 523. CrossRef - What made you do moonlighting? A tale from the Indonesian labor force survey
Padang Wicaksono, Dewi Kartika Sari, Reinaldy Sutanto
Cogent Social Sciences.2024;[Epub] CrossRef - CREDIT RISK ANALYSIS: AN ASSESSMENT OF THE PERFORMANCE OF SIX MACHINE LEARNING TECHNIQUES IN CREDIT SCORING MODELLING
Abba Bello Muhammad, Ishaq O. Olawoyin, Abubakar Yahaya, S. U. Gulumbe, Abdullahi. A. Muhammad, Iliyasu Abubakar Salisu
FUDMA JOURNAL OF SCIENCES.2024; 8(6): 163. CrossRef - Reliable water quality prediction and parametric analysis using explainable AI models
M. K. Nallakaruppan, E. Gangadevi, M. Lawanya Shri, Balamurugan Balusamy, Sweta Bhattacharya, Shitharth Selvarajan
Scientific Reports.2024;[Epub] CrossRef - Modeling the drivers of large herbivore distribution in human‐dominated southern African savannas
Dionísio V. Roque, Thomas Göttert, Ulrich Zeller, Valério A. Macandza
Ecosphere.2024;[Epub] CrossRef - Antecedents of Savings Behaviour Among Rural Households: A Holistic Approach
Mohd Abass Bhat, Geleta Demera Gomero, Shagufta Tariq Khan
FIIB Business Review.2024; 13(1): 56. CrossRef - The causal-effect model of input factor allocation on maize production: Using binary logistic regression in search for ways to be more productive
Muslim Salam, Rusli M. Rukka, Muh An-Nashrullah K. Samma, A. Nixia Tenriawaru, Rahmadanih, Ahmad Imam Muslim, Hamed Noralla Bakheet Ali, Muhammad Ridwan
Journal of Agriculture and Food Research.2024; 16: 101094. CrossRef - Sensing Biomechanical Alterations in Red Blood Cells of Type 1 Diabetes Patients: Potential Markers for Microvascular Complications
Riccardo Di Santo, Benedetta Niccolini, Alessandro Rizzi, Laura Bertini, Denise Pires Marafon, Maria Vaccaro, Federica Cristallo, Enrico Rosa, Linda Tartaglione, Laura Leo, Marco De Spirito, Gabriele Ciasca, Dario Pitocco
Biosensors.2024; 14(12): 587. CrossRef - Evaluating Rural Land Administration Institutional Efficiency from Modern Land Administration Systems Perspective: In Case of Awi Zone, North-Western Ethiopia
Dereje Shiferaw, Mihret Yeneneh, Teha Benti
Journal of Public Policy and Administration.2024; 8(3): 88. CrossRef - Predicting increments in heavy metal contamination in farmland soil
Jieh-Haur Chen, Meng-Fen Yeh, Jui-Pin Wang, Hsi-Hsien Wei
Environment, Development and Sustainability.2024;[Epub] CrossRef - Investigation of Risk Factors Associated with the African Swine Fever Outbreaks in the Nizhny Novgorod Region of Russia, 2011–2022
Olga I. Zakharova, Andrey A. Blokhin, Ivan V. Yashin, Olga A. Burova, Denis V. Kolbasov, Fedor I. Korennoy, Jordi Casal
Transboundary and Emerging Diseases.2023; 2023: 1. CrossRef - Determinants of bamboo processors' utilization level: The case of Bahir Dar city and Injibara town, Ethiopia
Tsadiku Setegne Dessie, Ahmed Mohammed Yimer, Mohammed Yimam Ali
Advances in Bamboo Science.2023; 5: 100043. CrossRef - Comprehensive breathing variability indices enhance the prediction of extubation failure in patients on mechanical ventilation
Qing Pan, Haoyuan Zhang, Mengting Jiang, Gangmin Ning, Luping Fang, Huiqing Ge
Computers in Biology and Medicine.2023; 153: 106459. CrossRef - A Survey on Machine Learning in Hardware Security
Troya Çağıl Köylü, Cezar Rodolfo Wedig Reinbrecht, Anteneh Gebregiorgis, Said Hamdioui, Mottaqiallah Taouil
ACM Journal on Emerging Technologies in Computing Systems.2023; 19(2): 1. CrossRef - Machine learning facilitated structural activity relationship approach for the discovery of novel inhibitors targeting EGFR
Rekha Choudhary, Vinayak Walhekar, Amol Muthal, Dilip Kumar, Chandrakant Bagul, Ravindra Kulkarni
Journal of Biomolecular Structure and Dynamics.2023; 41(22): 12445. CrossRef - What Factors Influence Consumers to Buy Green Products? An Analysis through the Motivation–Opportunity–Ability Framework and Consumer Awareness
Gizem Yener, Arzu Secer, Pascal L. Ghazalian
Sustainability.2023; 15(18): 13872. CrossRef - Relationships between Health Education, Health Behaviors, and Health Status among Migrants in China: A Cross-Sectional Study Based on the China Migrant Dynamic Survey
Minji Kim, Hai Gu
Healthcare.2023; 11(12): 1768. CrossRef - Multi-View Learning to Unravel the Different Levels Underlying Hepatitis B Vaccine Response
Fabio Affaticati, Esther Bartholomeus, Kerry Mullan, Pierre Van Damme, Philippe Beutels, Benson Ogunjimi, Kris Laukens, Pieter Meysman
Vaccines.2023; 11(7): 1236. CrossRef - Stacked Generalization Architecture for Predicting Publisher Behaviour from Highly Imbalanced User-Click Data Set for Click Fraud Detection
Deepti Sisodia, Dilip Singh Sisodia
New Generation Computing.2023; 41(3): 581. CrossRef - Textual Feature Extraction Using Ant Colony Optimization for Hate Speech Classification
Shilpa Gite, Shruti Patil, Deepak Dharrao, Madhuri Yadav, Sneha Basak, Arundarasi Rajendran, Ketan Kotecha
Big Data and Cognitive Computing.2023; 7(1): 45. CrossRef - Prevalence and Risk Factors for Poor Mental Health and Suicidal Ideation in the Nigerian Construction Industry
Janet M. Nwaogu, Albert P. C. Chan, Riza Yosia Sunindijo, Amos Darko, Jackie Y. Yang, Dauda Salihu
Journal of Construction Engineering and Management.2023;[Epub] CrossRef - A comprehensive analysis for classification and regression of surface points based on geodesics and machine learning algorithms
Vahide Bulut
Engineering Computations.2023; 40(9/10): 2270. CrossRef - Factors Influencing the Success of High-flow Nasal Cannula Treatment Applied to Respiratory Distress Patients with Hematologic Neoplasms
Eun Hee Kim, Dong Yeon Kim, Yang Sook Yoo
Asian Oncology Nursing.2023; 23(4): 185. CrossRef - Data Balancing Techniques for Predicting Student Dropout Using Machine Learning
Neema Mduma
Data.2023; 8(3): 49. CrossRef - Prevalence and severity of temporomandibular joint disorder in partially versus completely edentulous patients: A systematic review
Pragati Rawat, Deepesh Saxena, Pratiksha A. Srivastava, Abhinav Sharma, Arka Swarnakar, Aditya Sharma
The Journal of Indian Prosthodontic Society.2023; 23(3): 218. CrossRef - An Explainable Hybrid Intelligent System for Prediction of Cardiovascular Disease
Annwesha Banerjee Majumder, Somsubhra Gupta, Dharmpal Singh, Sourav Majumder
Journal of Mines, Metals and Fuels.2023; : 687. CrossRef - Asset Management of Wastewater Interceptors Adjacent to Bodies of Water
Mohammad Damen Bani Fawwaz, Mohammad Najafi, Vinayak Kaushal
Water.2023; 15(23): 4176. CrossRef - Comparison of Machine Learning Strategies in Hazardous Asteroids Prediction
Yao Wang
Highlights in Science, Engineering and Technology.2023; 39: 201. CrossRef - Healthcare predictive analytics using machine learning and deep learning techniques: a survey
Mohammed Badawy, Nagy Ramadan, Hesham Ahmed Hefny
Journal of Electrical Systems and Information Technology.2023;[Epub] CrossRef - Analyzing physical and socio-economic factors for property crime incident in Addis Ababa, Ethiopia
Yeshimar Yigzaw, Asnake Mekuriaw, Tadesse Amsalu
Heliyon.2023; 9(2): e13282. CrossRef - Mapping and Prediction of Urban Growth using Remote Sensing, Geographic Information System, and Statistical Techniques for Tiruppur Region, Tamil Nadu, India
K. Elangovan, G. Krishnaraaju
Journal of the Indian Society of Remote Sensing.2023; 51(8): 1657. CrossRef - Development of a predictive model for workers' involvement in workplace accidents in an underground coal mine
Kumar Arra, Yuga Raju Gunda, Suprakash Gupta
Sādhanā.2023;[Epub] CrossRef - A review on the significance of body temperature interpretation for early infectious disease diagnosis
Nurul Izzati Darul Zaman, Yuan Wen Hau, Ming Chern Leong, Rania Hussien Ahmed Al-ashwal
Artificial Intelligence Review.2023; 56(12): 15449. CrossRef - Unraveling Structural Alerts in Marketed Drugs for Improving Adverse Outcome Pathway Framework of Drug-Induced QT Prolongation
Wulin Long, Shihai Li, Yujie He, Jinzhu Lin, Menglong Li, Zhining Wen
International Journal of Molecular Sciences.2023; 24(7): 6771. CrossRef - The Influence of Street Morphology on Thermal Environment Based on ENVI-met Simulation: A Case Study of Hangzhou Core Area, China
Jin Bao, Lihua Xu, Yijun Shi, Qiwei Ma, Zhangwei Lu
ISPRS International Journal of Geo-Information.2023; 12(8): 303. CrossRef - An Asymmetric Ensemble Method for Determining the Importance of Individual Factors of a Univariate Problem
Jelena Mišić, Aleksandar Kemiveš, Milan Ranđelović, Dragan Ranđelović
Symmetry.2023; 15(11): 2050. CrossRef - Classification of WatSan Technologies Using Machine Learning Techniques
Hala Al Nuaimi, Mohamed Abdelmagid, Ali Bouabid, Constantinos V. Chrysikopoulos, Maher Maalouf
Water.2023; 15(15): 2829. CrossRef - A Study of R-R Interval Transition Matrix Features for Machine Learning Algorithms in AFib Detection
Sahil Patel, Maximilian Wang, Justin Guo, Georgia Smith, Cuixian Chen
Sensors.2023; 23(7): 3700. CrossRef - Determinants of viral load suppression among orphaned and vulnerable children living with HIV on ART in Tanzania
Amal Ally, Amon Exavery, John Charles, Levina Kikoyo, Remmy Mseya, Asheri Barankena, Rose Fovo, Akwila Temu
Frontiers in Public Health.2023;[Epub] CrossRef - An Economic Analysis of the Factors Affecting the Organization and Cultivation of the Wheat Crop in Iraq Using Logistic Regression
Noor Amer Ali, Ali Darub Kassar Al-Hiyali, Muhammed Khalid Muhammed
IOP Conference Series: Earth and Environmental Science.2023; 1158(9): 092001. CrossRef - An interpretable prediction model of illegal running into the opposite lane on curve sections of two-lane rural roads from drivers’ visual perceptions
Li He, Bo Yu, Yuren Chen, Shan Bao, Kun Gao, You Kong
Accident Analysis & Prevention.2023; 186: 107066. CrossRef - Explainable Artificial Intelligence of Multi-Level Stacking Ensemble for Detection of Alzheimer’s Disease Based on Particle Swarm Optimization and the Sub-Scores of Cognitive Biomarkers
Abdulaziz AlMohimeed, Redhwan M. A. Saad, Sherif Mostafa, Nora Mahmoud El-Rashidy, Sarah Farrag, Abdelkareem Gaballah, Mohamed Abd Elaziz, Shaker El-Sappagh, Hager Saleh
IEEE Access.2023; 11: 123173. CrossRef - Prediction of pine mistletoe infection using remote sensing imaging: A comparison of the artificial neural network model and logistic regression model
Ayhan Usta, Murat Yilmaz
Forest Pathology.2023;[Epub] CrossRef - Hydrogeochemical characterization of the groundwater of Lahore region using supervised machine learning technique
Sadia Ismail, M. Farooq Ahmed
Environmental Monitoring and Assessment.2023;[Epub] CrossRef - Managing Factors That Correlate to High Cohort Default Rate at Public 2-Year Community Colleges in Michigan
Emmanuel Obilor Njoku
Journal of Financial Risk Management.2023; 12(04): 328. CrossRef - TÜRK SİGORTACILIK SEKTÖRÜNDE UFRS 17’YE GEÇİŞ SÜRECİ VE SİGORTA ŞİRKETLERİNE OLASI ETKİLERİ
Gülcan ÇAĞIL, Cüneyt TUNÇ
Finansal Araştırmalar ve Çalışmalar Dergisi.2022; : 55. CrossRef - The effect of residential house rent on Urban households poverty status in Ethiopia: evidence from Wolkite town
Endalkachew Kabtamu Mekonen
Cogent Economics & Finance.2022;[Epub] CrossRef - Local perception of watershed degradation in the upper Gibe basin, southwest Ethiopia: implications to sustainable watershed management strategies
Fekadu Mengistu, Engdawork Assefa
International Journal of River Basin Management.2022; 20(2): 235. CrossRef - Pliable lasso for the multinomial logistic regression
Theophilus Quachie Asenso, Hai Zhang, Yong Liang
Communications in Statistics - Theory and Methods.2022; 51(11): 3596. CrossRef - Consumer choice for purchasing imported apparel goods and its effect on perceived saving in Debre Markos district, Amhara Ethiopia: A logistic regression analysis
Fasika Chekol, Yigardush Alimaw, Nitsuh Mengist, Ashebir Tsegaye
Cogent Social Sciences.2022;[Epub] CrossRef - A comparison of neural and non-neural machine learning models for food safety risk prediction with European Union RASFF data
Alberto Nogales, Rodrigo Díaz-Morón, Álvaro J. García-Tejedor
Food Control.2022; 134: 108697. CrossRef - Assessing Landslide Susceptibility by Coupling Spatial Data Analysis and Logistic Model
Antonio Ganga, Mario Elia, Ersilia D’Ambrosio, Simona Tripaldi, Gian Franco Capra, Francesco Gentile, Giovanni Sanesi
Sustainability.2022; 14(14): 8426. CrossRef - The Impact of Coping Strategies and Individual Resilience on Anxiety and Depression among Construction Supervisors
Janet M. Nwaogu, Albert P. C. Chan
Buildings.2022; 12(12): 2148. CrossRef - Differences in levels of E. coli contamination of point of use drinking water in Bangladesh
Md. Masud Hasan, Zahirul Hoque, Enamul Kabir, Shahadut Hossain, Mentore Vaccari
PLOS ONE.2022; 17(5): e0267386. CrossRef - Analysis of the tendency of transition between segments of green consumer behavior with a Markov chain approach
Aries Susanty, Pradita Yusi Akshinta, M. Mujiya Ulkhaq, Nia Budi Puspitasari
Journal of Modelling in Management.2022; 17(4): 1177. CrossRef - DravidianCodeMix: sentiment analysis and offensive language identification dataset for Dravidian languages in code-mixed text
Bharathi Raja Chakravarthi, Ruba Priyadharshini, Vigneshwaran Muralidaran, Navya Jose, Shardul Suryawanshi, Elizabeth Sherly, John P. McCrae
Language Resources and Evaluation.2022; 56(3): 765. CrossRef - Staff resilience and coping behavior as protective factors for mental health among construction tradesmen
Janet Mayowa Nwaogu, Albert P.C. Chan, Mershack Opoku Tetteh
Journal of Engineering, Design and Technology .2022; 20(3): 671. CrossRef - Investigating Which Services are Effective on Recommendation of the Airline Companies
Seden DOĞAN, Emrah ÖZKUL, Gamze KAYA
Advances in Hospitality and Tourism Research (AHTR).2022; 10(1): 109. CrossRef - Nature, patterns, and determinants of seasonal outmigration in the north-eastern part of Ethiopia
Girma Senbetie Asefawu, Kumela Gudeta Nedessa
Norsk Geografisk Tidsskrift - Norwegian Journal of Geography.2022; 76(3): 177. CrossRef - Civil servants’ integrity in public sector: the case of Nepal
Rajan Khanal, Anil Kumar Gupta, Prakash C. Bhattarai
Heliyon.2022; 8(12): e12632. CrossRef - Development of a prediction models for chemotherapy-induced adverse drug reactions: A retrospective observational study using electronic health records
Jeongah On, Hyeoun-Ae Park, Sooyoung Yoo
European Journal of Oncology Nursing.2022; 56: 102066. CrossRef - Structure-Activity Relationship (SAR) Model for Predicting Teratogenic Risk of Antiseizure Medications in Pregnancy by Using Support Vector Machine
Liyuan Kang, Yifei Duan, Cheng Chen, Shihai Li, Menglong Li, Lei Chen, Zhining Wen
Frontiers in Pharmacology.2022;[Epub] CrossRef - Preferences for service bundles in the energy sector – a survey of German private households
André Hackbarth, Timo Tremml, Sabine Löbbe
International Journal of Energy Sector Management.2022; 16(6): 1214. CrossRef - Classification of imbalanced medical data: An empirical study of machine learning approaches
Shikha Mundra, Shounak Vijay, Ankit Mundra, Punit Gupta, Mayank Kumar Goyal, Mandeep Kaur, Supriya Khaitan, Abha Kiran Rajpoot, Valentina Emilia Balas
Journal of Intelligent & Fuzzy Systems.2022; 43(2): 1933. CrossRef - Development and validation of a predictive scoring system for in-hospital mortality in COVID-19 Egyptian patients: a retrospective study
Mohamed AbdelSalam Elgohary, Asmaa Ali, Thanaa A. El-Masry, Hani Faidah, Farkad Bantun, Ahmad M. Elkholy, Jaklin S. Fahim, Nabila N. Elgamal, Mohamed Emam Mohamed, Mohamed G. Seadawy, Amro M. Helal, Michel De Waard, Hesham M. Shishtawy, Maisra M. El-Bouse
Scientific Reports.2022;[Epub] CrossRef - Intelligent modeling of unconfined compressive strength (UCS) of hybrid cement-modified unsaturated soil with nanostructured quarry fines inclusion
Kennedy C. Onyelowe, Fazal E. Jalal, Mudassir Iqbal, Zia Ur Rehman, Kizito Ibe
Innovative Infrastructure Solutions.2022;[Epub] CrossRef - Neutron/gamma pulse shape discrimination using short-time frequency transform
Assem Abdelhakim, Ehab Elshazly
Analog Integrated Circuits and Signal Processing.2022; 111(3): 387. CrossRef - Paradox of Success-Mediated Conflicts: Analysing Attitudes of Local Communities Towards Successfully Reintroduced Tigers in India
Manjari Malviya, Sankar Kalyanasundaram, Ramesh Krishnamurthy
Frontiers in Conservation Science.2022;[Epub] CrossRef - Simulation of Acute Pulmonary Hypertension in Beagle Dogs
Miao Wang, YaTing Hu, BinBin Guo, Hong Tang
International Heart Journal.2022; 63(3): 612. CrossRef - An Analytical Predictive Models and Secure Web-Based Personalized Diabetes Monitoring System
Radwa Marzouk, Ala Saleh Alluhaidan, Sahar A. El Rahman
IEEE Access.2022; 10: 105657. CrossRef - Practical Machine Learning Model to Predict the Recovery of Motor Function in Patients with Stroke
Jeoung Kun Kim, Zhihan Lv, Donghwi Park, Min Cheol Chang
European Neurology.2022; 85(4): 273. CrossRef - Analyzing Various Factors Affecting Farmers’ Willingness to Adopt Soil Erosion Control Measures in the Sebeya Catchment, Rwanda
Félicien Majoro, Umaru Garba Wali
Sustainability.2022; 14(19): 12895. CrossRef - Risk Factors Associated with Tuberculosis Among Men; A Study of South Africa
Muziwandile Nhlakanipho Mlondo, Sileshi Fanta Melesse, Henry G Mwambi
The Open Public Health Journal.2022;[Epub] CrossRef - Artificial intelligence methods for improving the inventive design process, application in lattice structure case study
Masih Hanifi, Hicham Chibane, Remy Houssin, Denis Cavallucci, Naser Ghannad
Artificial Intelligence for Engineering Design, Analysis and Manufacturing.2022;[Epub] CrossRef - TheImpacts of Apple-based Agroforestry Practices on the Livelihoods of Smallholder Farmers in Southern Ethiopia
Tesfaye Gebeyehu Admasu, Amene Afework Jenberu
Trees, Forests and People.2022; 7: 100205. CrossRef - Relation of Dietary n-3 and n-6 Fatty Acid Intakes to Metabolic Syndrome in Middle-Aged People Depending on the Level of HbA1c: A Review of National Health and Nutrition Survey Data from 2014 to 2016
Seo-Woo Park, Do-Yeong Kim, Gyeong-Tae Bak, Dae-Sung Hyun, Sung-Kyung Kim
Medicina.2022; 58(8): 1017. CrossRef - Prevalence and factors associated with pre‐frailty and frailty among Korean older adults with heart failure
Youn‐Jung Son, Sang‐Wook Kim, Wang‐Soo Lee, Seung Yong Shin, Hoyoun Won, Jun Hwan Cho, Hyue Mee Kim, Joonhwa Hong, JiYeon Choi
Journal of Advanced Nursing.2022; 78(10): 3235. CrossRef - An Ensemble Heart Disease Prediction Model Bagged with Logistic Regression, Naïve Bayes and K Nearest Neighbour.
Annwesha Banerjee Majumder, Somsubhra Gupta, Dharmpal Singh
Journal of Physics: Conference Series.2022; 2286(1): 012017. CrossRef - Motives for the introduction of agricultural innovations in Serbia with particular accent on beekeepers: The application of logistic regression
Lidija Madžar
Ekonomika poljoprivrede.2022; 69(1): 27. CrossRef - Predicting Ischemic Stroke in Patients with Atrial Fibrillation Using Machine Learning
Seonwoo Jung, Min-Keun Song, Eunjoo Lee, Sejin Bae, Yeon-Yong Kim, Doheon Lee, Myoung Jin Lee, Sunyong Yoo
Frontiers in Bioscience-Landmark.2022;[Epub] CrossRef - Quantitative Structure–Activity Relationship (QSAR) Model for the Severity Prediction of Drug-Induced Rhabdomyolysis by Using Random Forest
Yifan Zhou, Shihai Li, Yiru Zhao, Mingkun Guo, Yuan Liu, Menglong Li, Zhining Wen
Chemical Research in Toxicology.2021; 34(2): 514. CrossRef - Knowledge extraction from pointer movements and its application to detect uncertainty
Catia Cepeda, Maria Camila Dias, Dina Rindlisbacher, Hugo Gamboa, Marcus Cheetham
Heliyon.2021; 7(1): e05873. CrossRef - Predicting the Utilization of Mental Health Treatment with Various Machine Learning Algorithms
Meera Sharma, Sonok Mahapatra, Adeethyia Shankar, Xiaodi Wang
WSEAS TRANSACTIONS ON COMPUTERS.2021; 19: 285. CrossRef - Talking about Sustainability: How the Media Construct the Public’s Understanding of Sustainable Food in Romania
Valentina Marinescu, Bianca Fox, Darie Cristea, Daniela Roventa-Frumusani, Ramona Marinache, Silvia Branea
Sustainability.2021; 13(9): 4609. CrossRef - TÜRK SİGORTACILIK SEKTÖRÜNDE UFRS 17’YE GEÇİŞ SÜRECİ VE SİGORTA ŞİRKETLERİNE OLASI ETKİLERİ
Cüneyt TUNÇ
Finansal Araştırmalar ve Çalışmalar Dergisi.2021;[Epub] CrossRef - Analysis of Unmet Healthcare Needs in Ireland: A Data Mining Approach
Dr. Anatoli Nachev
International Journal of Engineering and Advanced Technology.2021; 10(3): 81. CrossRef - Performance analysis of Word Embeddings for Cyberbullying Detection
Subbaraju Pericherla, E Ilavarasan
IOP Conference Series: Materials Science and Engineering.2021; 1085(1): 012008. CrossRef - The usage of logistic regression and artificial neural networks for evaluation and predicting property-liability insurers' solvency in Egypt
Eid Elghaly Hassan, Diping Zhang
Data Science in Finance and Economics.2021; 1(3): 215. CrossRef - Predicting the Safety Climate in Construction Sites of Saudi Arabia: A Bootstrapped Multiple Ordinal Logistic Regression Modeling Approach
Anas A. Makki, Ibrahim Mosly
Applied Sciences.2021; 11(4): 1474. CrossRef - Community participation in watershed management: analysis of the status and factors affecting community engagement in the upper Gibe basin, South West Ethiopia
Fekadu Mengistu, Engdawork Assefa
Journal of Environmental Planning and Management.2021; 64(2): 252. CrossRef - AGRICULTURAL INNOVATIONS, EXTENSION, FINANCE AND RURAL LOANS IN THE REPUBLIC OF SERBIA:
THE CASE OF LOGISTIC REGRESSION
Lidija Madžar
Annals of the Polish Association of Agricultural and Agribusiness Economists.2021; XXIII(4): 129. CrossRef - An Approach Using Fuzzy Sets and Boosting Techniques to Predict Liver Disease
Pushpendra Kumar, Ramjeevan Singh Thakur
Computers, Materials & Continua.2021; 68(3): 3513. CrossRef - Does engagement with frontline health workers improve maternal and child healthcare utilisation and outcomes in India?
Anu Rammohan, Srinivas Goli, Shashi Kala Saroj, C. P. Abdul Jaleel
Human Resources for Health.2021;[Epub] CrossRef - Assessing risk factors associated with urban transit bus involved accident severity: a case study of a Middle East country
Mehrdad Nasri, Kayvan Aghabayk
International Journal of Crashworthiness.2021; 26(4): 413. CrossRef - Detecting Information on the Spread of Dengue on Twitter Using Artificial Neural Networks
Samina Amin, M. Irfan Uddin, M. Ali Zeb, Ala Abdulsalam Alarood, Marwan Mahmoud, Monagi H. Alkinani
Computers, Materials & Continua.2021; 67(1): 1317. CrossRef - Automatic Evaluation of Heart Condition According to the Sounds Emitted and Implementing Six Classification Methods
Manuel A. Soto-Murillo, Jorge I. Galván-Tejada, Carlos E. Galván-Tejada, Jose M. Celaya-Padilla, Huizilopoztli Luna-García, Rafael Magallanes-Quintanar, Tania A. Gutiérrez-García, Hamurabi Gamboa-Rosales
Healthcare.2021; 9(3): 317. CrossRef - Visual light perceptions caused by medical linear accelerator: Findings of machine-learning algorithms in a prospective questionnaire-based case–control study
Chao-Yang Kuo, Cheng-Chun Lee, Yuh-Lin Lee, Shueh-Chun Liou, Jia-Cheng Lee, Emily Chia-Yu Su, Yi-Wei Chen, Rongxiao Zhang
PLOS ONE.2021; 16(2): e0247597. CrossRef - Health-seeking behavior and waste management practices among women in major urban markets in Owerri, Nigeria
Cyprian Ezedike, Eudora Ohazurike, Faisal C Emetumah, Okechukwu O Ajaegbu
AIMS Public Health.2020; 7(1): 169. CrossRef - A cross-sectional study to determine factors affecting dental and medical students’ preference for virtual learning during the COVID-19 outbreak
Nosayba Al-Azzam, Lina Elsalem, Farai Gombedza
Heliyon.2020; 6(12): e05704. CrossRef - Machine Learning Algorithms in Cardiology Domain: A Systematic Review
Aleksei Dudchenko, Matthias Ganzinger, Georgy Kopanitsa
The Open Bioinformatics Journal.2020; 13(1): 25. CrossRef - Effect of Succession Planning on Leadership Elevation
Ammad Zafar, Ghazal Khawaja Hummayun Akhtar
Pakistan Journal of Applied Social Sciences.2020; 11(2): 21. CrossRef - Postpartum depression and its correlates in middle‐class women in Hunan, China
Ziyao Guan, Wenhui Bai, Chunxiang Qin, Mei Sun, Xiaoling Bai, Siyuan Tang
Asian Social Work and Policy Review.2020; 14(2): 107. CrossRef - A Regression Model for Predicting the Likelihood of Reporting a Crime Based on the Victim’s Demographic Variables and Their Perceptions Towards the Police
Malebogo Pulenyane, Tlhalitshi Volition Montshiwa
Statistics, Politics and Policy.2020; 11(2): 167. CrossRef - Gender differences in the relationships between sleep disturbances and academic performance among nursing students: A cross-sectional study
Ollyvia Freeska Dwi Marta, Shu-Yu Kuo, Jacqueline Bloomfield, Hsin-Chien Lee, Faqih Ruhyanudin, Mia Yuangi Poynor, Ageng Brahmadhi, Indah Dwi Pratiwi, Nur Aini, Erma Wahyu Mashfufa, Faizul Hasan, Hsiao-Yean Chiu
Nurse Education Today.2020; 85: 104270. CrossRef - Prediction of physical violence in schizophrenia with machine learning algorithms
Kevin Z. Wang, Ali Bani-Fatemi, Christopher Adanty, Ricardo Harripaul, John Griffiths, Nathan Kolla, Philip Gerretsen, Ariel Graff, Vincenzo De Luca
Psychiatry Research.2020; 289: 112960. CrossRef - Assessment of a Deep Learning Algorithm for the Detection of Rib Fractures on Whole-Body Trauma Computed Tomography
Thomas Weikert, Luca Andre Noordtzij, Jens Bremerich, Bram Stieltjes, Victor Parmar, Joshy Cyriac, Gregor Sommer, Alexander Walter Sauter
Korean Journal of Radiology.2020; 21(7): 891. CrossRef - Application of logistic regression analysis in prediction of groundwater vulnerability in gold mining environment: a case of Ilesa gold mining area, southwestern, Nigeria
K. A. N. Adiat, B. E. Akeredolu, A. A. Akinlalu, G. M. Olayanju
Environmental Monitoring and Assessment.2020;[Epub] CrossRef - Eco-Kansei design for retailing packaging: a current research progress
A Aprilia, T Djatna, N S Indrasti, Sugiarto
IOP Conference Series: Earth and Environmental Science.2020; 472(1): 012046. CrossRef - Knowledge mining on the association between psychological capital and educational qualifications among hospitality employees
Donald Douglas Atsa’am, Ersin Kuset Bodur
Current Issues in Tourism.2020; 23(9): 1073. CrossRef - Predicting Dysfunctional Human–Dog Dyads
Rute Canejo-Teixeira, Pedro Armelim Almiro, Luís V. Baptista, Maria Manuela Grave Rodeia Espada Niza
Anthrozoös.2020; 33(6): 743. CrossRef - Entrepreneurship factor’s affecting the youth decision to continue their family farm
S F Ayu, M Nauly
Journal of Physics: Conference Series.2020; 1542(1): 012052. CrossRef - Farmers’ Attitudes Towards the Use of Biomass as Renewable Energy—A Case Study from Southeastern Europe
Prespa Ymeri, Csaba Gyuricza, Csaba Fogarassy
Sustainability.2020; 12(10): 4009. CrossRef - AI Approaches towards Prechtl’s Assessment of General Movements: A Systematic Literature Review
Muhammad Tausif Irshad, Muhammad Adeel Nisar, Philip Gouverneur, Marion Rapp, Marcin Grzegorzek
Sensors.2020; 20(18): 5321. CrossRef - Logistic Regression and Least Absolute Shrinkage and Selection Operator
Hyunyong Lee, Hun-Sung Kim
Cardiovascular Prevention and Pharmacotherapy.2020; 2(4): 142. CrossRef - A modular framework for estimating annual averaged power output generation of wind turbines
Benjamin Wacker, Johann V. Seebaß, Jan Chr. Schlüter
Energy Conversion and Management.2020; 221: 113149. CrossRef - Interest to continue farming among agricultural students who is a child of a farmer
S F Ayu, M Nauly
IOP Conference Series: Earth and Environmental Science.2020; 454(1): 012027. CrossRef - Assessment of Teachers’ Knowledge about Tuberculosis at Primary School in Balad City
Wafaa S. Hasanain
Journal of Physics: Conference Series.2020; 1591(1): 012001. CrossRef - A Comparative Assessment of Credit Risk Model Based on Machine Learning ——a case study of bank loan data
Yuelin Wang, Yihan Zhang, Yan Lu, Xinran Yu
Procedia Computer Science.2020; 174: 141. CrossRef - Machine Learning Algorithms in Cardiology Domain: A Systematic Review (Preprint)
Georgy Kopanitsa, Aleksei Dudchenko, Matthias Ganzinger
JMIR Medical Informatics.2019;[Epub] CrossRef - Determinants of child labour practices in Ghana
Lucy Twumwaah Afriyie, Bashiru I. I. Saeed, Abukari Alhassan
Journal of Public Health.2019; 27(2): 211. CrossRef - Mapping fecal pollution in rural groundwater supplies by means of artificial intelligence classifiers
S. Díaz-Alcaide, P. Martínez-Santos
Journal of Hydrology.2019; 577: 124006. CrossRef - A Hybrid Computational Intelligence Approach to Groundwater Spring Potential Mapping
Dieu Tien Bui, Ataollah Shirzadi, Kamran Chapi, Himan Shahabi, Biswajeet Pradhan, Binh Pham, Vijay Singh, Wei Chen, Khabat Khosravi, Baharin Bin Ahmad, Saro Lee
Water.2019; 11(10): 2013. CrossRef - Determinants of environmental conservation in Lake Tana Biosphere Reserve, Ethiopia
Zemenu Bires, Sahil Raj
Heliyon.2019; 5(7): e01997. CrossRef - Drivers of Cooperation Activity in Kosovo’s Agriculture
Shyhrete Muriqi, Maria Fekete-Farkas, Zsolt Baranyai
Agriculture.2019; 9(5): 96. CrossRef - Determinants of paying national health insurance premium with mobile phone in Ghana: a cross-sectional prospective study
Joseph Marfo Boaheng, Eugenia Amporfu, Daniel Ansong, Anthony Kofi Osei-Fosu
International Journal for Equity in Health.2019;[Epub] CrossRef - Determining Factors Affecting Consumer’s Decision to Purchase Organic Chicken Meat
F Kaygisiz, BA Bolat, D Bulut
Brazilian Journal of Poultry Science.2019;[Epub] CrossRef - Performance and cost-effectiveness of change burst metrics in predicting software faults
Malanga Kennedy Ndenga, Ivaylo Ganchev, Jean Mehat, Franklin Wabwoba, Herman Akdag
Knowledge and Information Systems.2019; 60(1): 275. CrossRef - Detection of Timestamps Tampering in NTFS using Machine Learning
Alji Mohamed, Chougdali Khalid
Procedia Computer Science.2019; 160: 778. CrossRef - Responding to the greatest challenges? Value creation in ecological startups
Andreas Kuckertz, Elisabeth S.C. Berger, Anja Gaudig
Journal of Cleaner Production.2019; 230: 1138. CrossRef - Sewer Pipes Condition Prediction Models: A State-of-the-Art Review
Mohammadreza Malek Mohammadi, Mohammad Najafi, Vinayak Kaushal, Ramtin Serajiantehrani, Nazanin Salehabadi, Taha Ashoori
Infrastructures.2019; 4(4): 64. CrossRef - TLUSBoost algorithm: a boosting solution for class imbalance problem
Sujit Kumar, Saroj Kr. Biswas, Debashree Devi
Soft Computing.2019; 23(21): 10755. CrossRef - Analysis between GPA and TOEFL Score For Postgraduate Student of Sports Education using Bivariate Logistic Regression
A Sofro, A Oktaviarina, E Mintarto, O Wiriawan
Journal of Physics: Conference Series.2019; 1417(1): 012022. CrossRef - A Review of the Logistic Regression Model with Emphasis on Medical Research
Ernest Yeboah Boateng, Daniel A. Abaye
Journal of Data Analysis and Information Processing.2019; 07(04): 190. CrossRef - Suicidal ideation in systemic lupus erythematosus: NR2A gene polymorphism, clinical and psychosocial factors
R I Buji, N A Abdul Murad, L F Chan, T Maniam, M S Mohd Shahrir, M Rozita, A S Shamsul, R Mohamad Hussain, N Abdullah, R Jamal, N R Nik Jaafar
Lupus.2018; 27(5): 744. CrossRef - The use of geographic information system and 1860s cadastral data to model agricultural suitability before heavy mechanization. A case study from Malta
Gianmarco Alberti, Reuben Grima, Nicholas C. Vella, Hugo Rebelo
PLOS ONE.2018; 13(2): e0192039. CrossRef - Drivers of eco-innovation in the manufacturing sector of Nigeria
Maruf Sanni
Technological Forecasting and Social Change.2018; 131: 303. CrossRef - Spatial filtering pipeline evaluation of cortically coupled computer vision system for rapid serial visual presentation
Zhengwei Wang, Graham Healy, Alan F. Smeaton, Tomas E. Ward
Brain-Computer Interfaces.2018; 5(4): 132. CrossRef - Logistic Regression and Growth Charts to Determine Children Nutritional and Stunting Status: A Review
Margaretha Ohyver, Jurike V. Moniaga, Karina Restisa Yunidwi, Muhamad Irfan Setiawan
Procedia Computer Science.2017; 116: 232. CrossRef - Predictors of Unintentionally Severe Harm During Nonsuicidal Self‐Injury
Trevor J. Buser, Juleen K. Buser, Corrine C. Rutt
Journal of Counseling & Development.2017; 95(1): 14. CrossRef - Women’s opinion on the justification of physical spousal violence: A quantitative approach to model the most vulnerable households in Bangladesh
Raaj Kishore Biswas, Nusma Rahman, Enamul Kabir, Farabi Raihan, Fakir M Amirul Islam
PLOS ONE.2017; 12(11): e0187884. CrossRef - Well-testing model identification using time-series shapelets
Rouhollah Ahmadi, Babak Aminshahidy, Jamal Shahrabi
Journal of Petroleum Science and Engineering.2017; 149: 292. CrossRef - Proposing stochastic probability-based math model and algorithms utilizing social networking and academic data for good fit students prediction
Muhammad Fahim Uddin, Jeongkyu Lee
Social Network Analysis and Mining.2017;[Epub] CrossRef - Infrared assessment of knee instability in ACL deficient patients
Aleksandar Matić, Suzana Petrović Savić, Branko Ristić, Vladan B. Stevanović, Goran Devedžić
International Orthopaedics.2016; 40(2): 385. CrossRef - Binary Logistic Model for Estimation of Mode Shift into Delhi Metro
Vineet Chauhan, Hemant K. Suman, Nomesh B. Bolia
The Open Transportation Journal.2016; 10(1): 124. CrossRef - Analysis of the Factors Influencing the Use of Public Buses in Delhi
Hemant K. Suman, Nomesh B. Bolia, Geetam Tiwari
Journal of Urban Planning and Development.2016;[Epub] CrossRef - Are predictors of future suicide attempts and the transition from suicidal ideation to suicide attempts shared or distinct: A 12-month prospective study among patients with depressive disorders
Lai Fong Chan, Azhar Shah Shamsul, Thambu Maniam
Psychiatry Research.2014; 220(3): 867. CrossRef
 Cite
CiteAn Introduction to Logistic Regression: From Basic Concepts to Interpretation with Particular Attention to Nursing Domain

Figure 1
Graph of logistic curve where α=0 and β=1.
Figure 1
An Introduction to Logistic Regression: From Basic Concepts to Interpretation with Particular Attention to Nursing Domain
Sample Classification Table
a, b, c, and d are number of observations in the corresponding cells.
Example Output from Logistic Regression: Statistical Tests of Individual Predictors
CI=Confidence interval; df=Degrees of freedom; OR=Odds ratio; SE=Standard error.
Example Output from Logistic Regression: Overall Model Evaluation and Goodness-of-Fit Statistics
Example Output from Logistic Regression: A Classification Table
Sensitivity=3/(3+57)=5.00%; Specificity=124/(6+124)=95.48%;
False positive=6/(6+124)=4.62%; False negative=57/(3+57)=95.00%.
Adherence to Guidelines for Using and Reporting Logistic Regression
NR=Not reported; VIF=Variance inflation factor; AUC=Area under curve; ROC=Receiver operationg characteristic; AIC=Akaike's information criterion; LL=Log-likelihood CI=Confidence interval; df=Degrees of freedom; OR=Odds ratio; SE=Standard error.
Table 1
Sample Classification Table
Table 2
Example Output from Logistic Regression: Statistical Tests of Individual Predictors
CI=Confidence interval; df=Degrees of freedom; OR=Odds ratio; SE=Standard error.
Table 3
Example Output from Logistic Regression: Overall Model Evaluation and Goodness-of-Fit Statistics
Table 4
Example Output from Logistic Regression: A Classification Table
Sensitivity=3/(3+57)=5.00%; Specificity=124/(6+124)=95.48%; False positive=6/(6+124)=4.62%; False negative=57/(3+57)=95.00%.
Table 5
Adherence to Guidelines for Using and Reporting Logistic Regression
NR=Not reported; VIF=Variance inflation factor; AUC=Area under curve; ROC=Receiver operationg characteristic; AIC=Akaike's information criterion; LL=Log-likelihood CI=Confidence interval; df=Degrees of freedom; OR=Odds ratio; SE=Standard error.

