 Submit an article
Articles
- Page Path
- HOME > J Korean Acad Nurs > Volume 41(6); 2011 > Article
-
Original Article
- Usefulness of Estimated Height Loss for Detection of Osteoporosis in Women
- Soon Gyo Yeoum, Jong Hwa Lee
-
Journal of Korean Academy of Nursing 2011;41(6):758-767.
DOI: https://doi.org/10.4040/jkan.2011.41.6.758
Published online: December 31, 2011
1Associate Professor, Department of Nursing, Seoil University, Seoul, Korea.
2Full-time Lecturer, Department of Nursing, Kunsan College of Nursing, Gunsan, Korea.
- Address reprint requests to: Yeoum, Soon Gyo. Department of Nursing, Seoil University, Seoildaehak-gill 22, Jungrang-gu, Seoul 131-702, Korea. Tel: +82-2-490-7580, FAX: +82-2-490-7555, yeoumsg@seoil.ac.kr
• Received: May 30, 2011 • Revised: June 4, 2011 • Accepted: December 9, 2011
© 2011 Korean Society of Nursing Science
Abstract
-
Purpose
- This study was done to examine the threshold value of estimated height loss at which the risk of osteoporosis increases and to verify its discriminative ability in the detection of osteoporosis.
-
Methods
- It was conducted based on epidemiological descriptive methods on 732 Korean women at a public healthcare center in Seoul between July and November 2010. ANOVA, Pearson correlation, logistic regression analysis and receiver operating characteristics (ROC) curve were used for data analysis.
-
Results
- There was an age-related correlation between bone mineral density (lumbar spine: F=37.88, p<.001; femur: F=54.27, p<.001) and estimated height loss (F=27.68, p<.001). Estimated height loss increased significantly with decreasing bone mineral density (lumbar spine: r=-.23, p<.001; femur: r=-.34, p<.001). The odds ratio for the point at which the estimated height loss affects the occurrence of osteoporosis was found to increase at a cut-off value of 2 cm and the area under ROC curve was .71 and .82 in lumbar spine and femur, respectively.
-
Conclusion
- The optimal cut-off value of the estimated height loss for detection of osteoporosis was 2 cm. Height loss is therefore a useful indicator for the self-assessment and prognosis of osteoporosis.
INTRODUCTION
METHODS
1) Bone mineral density
2) Height
RESULTS
DISCUSSION
CONCLUSION
- 1. Adachi JD, Ioannidis G, Berger C, Joseph L, Papaioannou A, Pickard L, et al. The influence of osteoporotic fractures on health-related quality of life in community dwelling men and women across Canada. Osteoporosis International. 2001;12:903–908. doi: 10.1007/s001980170017.ArticlePubMedPDF
- 2. Center JR, Nguyen TV, Pocock NA, Noakes KA, Kelly PJ, Eisman JA, et al. Femoral neck axis length, height loss, and risk of hip fracture in males and females. Osteoporosis International. 1998;8:75–81. doi: 10.1007/s001980050051.ArticlePubMedPDF
- 3. Francis RM, Aspray TJ, Hide G, Suteliffe AM, Wilkinson P. Back pain in osteoporotic vertebral fractures. Osteoporosis International. 2008;19:895–903. doi: 10.1007/s00198-007-0530-x.ArticlePubMedPDF
- 4. Ismail AA, Cooper C, Felsenberg D, Varlow J, Kanis JA, Silman AJ, et al. Number and type of vertebral deformities: Epidemiological characteristics and relation to back pain and height loss. Osteoporosis International. 1999;9:206–213. doi: 10.1007/s001980050138.ArticlePubMedPDF
- 5. Joakimsen RM, Fønnebø V, Magnus JH, Tollan A, Johanne Søgaard A. The Tromsø study: Body height, body mass index and fractures. Osteoporosis International. 1998;8:436–442. doi: 10.1007/s001980050080.ArticlePubMedPDF
- 6. Kanis JA, Glüer CC. An update on the diagnosis and assessment of osteoporosis with densitometry. Osteoporosis International. 2000;11:192–202. doi: 10.1007/s001980050281.ArticlePubMedPDF
- 7. Kim KS. The 4th summing-up in osteoporosis, 2001: Physiology of the bone. 2001;Seoul, The Korean Society of Bone Metabolism. 9–12.
- 8. Health and welfare reports-domestic. Korea Institute for Health and Social Affairs. 2010a;Retrived March 10, 2010. from http://www.kihasa.re.kr/html/jsp.
- 9. Health and welfare reports-domestic. Korea Institute for Health and Social Affairs. 2010b;Retrived January 27, 2010. from http://www.kihasa.re.kr/html/jsp.
- 10. Krege JH, Siminoski K, Adachi JD, Misurski DA, Chen P. A simple method for determining the probability a new vertebral fracture is present in postmenopausal women with osteoporosis. Osteoporosis International. 2006;17:379–386. doi: 10.1007/s00198-005-2005-2.ArticlePubMedPDF
- 11. Masunari N, Fujiwara Y, Nakata E, Nakashima E, Nakamura T. Historical height loss, vertebral deformity, and health related quality of life in Hiroshima cohort study. Osteoporosis International. 2007;18:1493–1499. doi: 10.1007/s00198-007-0392-2.ArticlePubMedPDF
- 12. Meyer HE, Falch JA, O'Neill T, Tverdal A, Varlow J. Height and body mass index in Oslo, Norway, compared to other regions of Europe: Do they explain differences in the incidence of hip fracture? Bone. 1995;17:347–350. doi: 10.1016/s8756-3282(95)00245-6.ArticlePubMed
- 13. Milliken LA, Cussler E, Zeller RA, Choi JE, Metcalfe L, Going SB, et al. Changes in soft tissue composition are the primary predictors of 4-year bone mineral density changes in postmenopausal women. Osteoporosis International. 2009;20:347–354. doi: 10.1007/s00198-008-0664-5.ArticlePubMedPDF
- 14. Moayyeri A, Ahmadi-Abhari S, Hossein-nezhad A, Larijani B, Soltani A. Bone mineral density and estimated height loss based on patients' recalls. Osteoporosis International. 2006;17:834–840. doi: 10.1007/s00198-005-0046-1.ArticlePubMedPDF
- 15. Nicholson PHF, Haddaway MJ, Davie MWJ, Evans SF. Vertebral deformity, bone mineral density, back pain and height loss in unscreened women over 50 years. Osteoporosis International. 1993;3:300–307. doi: 10.1007/BF01637315.ArticlePubMedPDF
- 16. North American Menopause Society. Management of osteoporosis in postmenopausal women: Position statement of the North American Menopause Society. Menopause. 2006;13:340–367.PubMed
- 17. Park IH. The 7th osteoporosis summing-up: Diagnosis of osteoporosis. 2004;Seoul, The Korean Society of Bone Metabolism. 7–12.
- 18. Park HM. Phytoestrogen. 2005;Seoul, Koonja.
- 19. Pfirrmann CWA, Metzdorf A, Elfering A, Hodler J, Boos N. Effect of aging and degeneration on disc volume and shape: A quantitative study in asymptomatic volunteers. Journal of Orthopaedic Research. 2006;24:1086–1094. doi: 10.1002/jor.20113.ArticlePubMed
- 20. Schlaich C, Minne HW, Bruckner T, Wagner G, Gebest HJ, Grunze M, et al. Reduced pulmonary function in patients with spinal osteoporotic fracture. Osteoporosis International. 1998;8:261–267. doi: 10.1007/s001980050063.ArticlePubMedPDF
- 21. Siminoski K, Jiang G, Adachi JD, Hanley DA, Cline G, Ioannidis G, et al. Accuracy of height loss during prospective monitoring for detection of incident vertebral fractures. Osteoporosis International. 2005;16:403–410. doi: 10.1007/s00198-004-1709-Z.ArticlePubMedPDF
- 22. Siminoski K, Washawski RS, Jen K, Lee K. The accuracy of historical height loss for the detection of vertebral fractures in postmenopausal women. Osteoporosis International. 2006;17:290–296. doi: 10.1007/s00198-005-2017-y.ArticlePubMedPDF
- 23. Song SW. Using the receiver operating characteristic curve to measure sensitivity and specificity. Korean Journal of Family Medicine. 2009;30:841–842. doi: 10.4082/kjfm.2009.30.11.841.
- 24. Sorkin JD, Muller DC, Andres R. Longitudinal change in height of men and women: Implications for interpretation of the body mass index. American Journal of Epidemiology. 1999;150:969–977.ArticlePubMed
- 25. Tobias JH, Hutchinson AP, Hunt LP, McCloskey EV, Stone MD, Martin JC, et al. Use of clinical risk factors to identify postmenopausal women with vertebral fractures. Osteoporosis International. 2007;18:35–43. doi: 10.1007/s00198-006-0209-8.ArticlePubMedPDF
- 26. Versluis RG, Petri H, van de Ven CM, Scholtes AB, Broerse ER, Springer MP, et al. Usefulness of armspan and height comparison in detecting vertebral deformities in women. Osteoporosis International. 1999;9:129–133. doi: 10.1007/s001980050125.ArticlePubMedPDF
- 27. Vokes T, Bachman D, Baim S, Binkley N, Broy S, Ferrar L, et al. Vertebral fracture assessment: The 2005 ISCD official position. Journal of Clinical Densitometry. 2006;9:37–46. doi: 10.1013/j.jocd.2006.05.006.ArticlePubMed
- 28. Yang SG. The 8th osteoporosis summing-up: Diagnosis of the osteoporosis. 2008;Seoul, The Korean Society of Bone Metabolism. 99–113.
- 29. Yoshimura N, Kinoshita H, Takijiri T, Oka H, Muraki S, Mabuchi A, et al. Association between height loss and bone loss, cumulative incidence of vertebral fractures and future quality of life: The Miyama study. Osteoporosis International. 2008;19:21–28. doi: 10.1007/s00198-007-0474-1.ArticlePubMedPDF
- 30. Yu HJ. Training course 2001: Diagnosis of obesity. 2001;Seoul, Korean Society for the Study of Obesity. 5–9.
REFERENCES
Figure 1
Bone mineral density and estimated height loss by age (N=732).
Bone mineral density (BMD) is significant different from the age (Lumbar spine: F=37.88, p<.001, Femur: F=54.27, p<.001); The correlation BMD and height loss is negatively significant (Lumbar spine: r=-.23, p<.001, Femur: r=-.34, p<.001).

Figure 2
Estimated height loss by bone mineral density (N=568).
T-score is absolute value (ex: l T-score l 2.5 → -2.5); Estimated height loss is significant different from T-score (Lumbar spine: F=4.60, p<.001; Femur: F=12.99, p<.001).
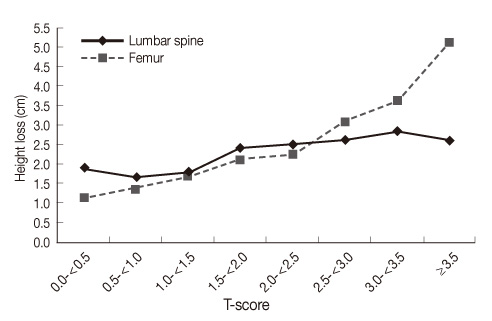
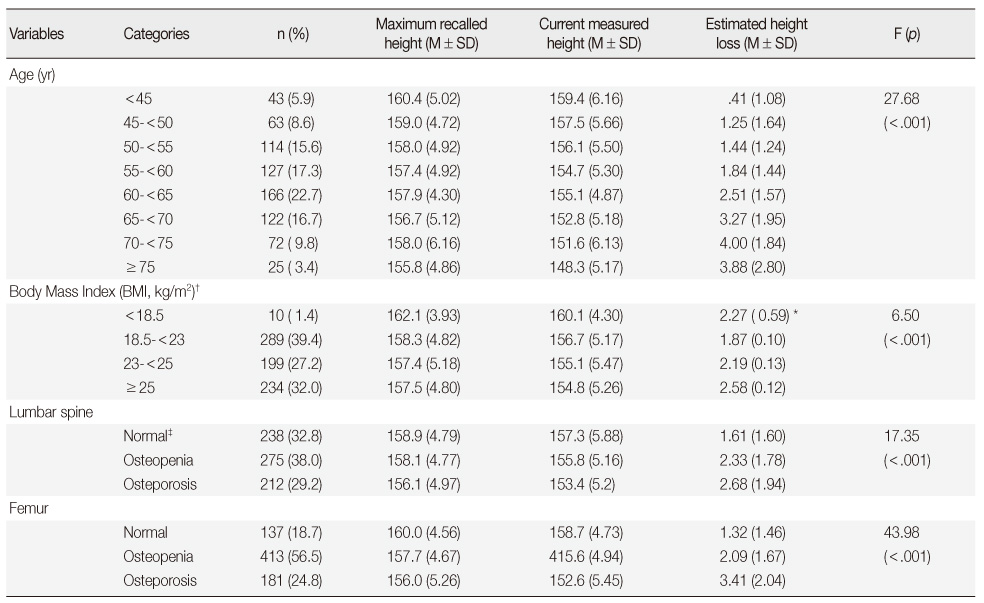
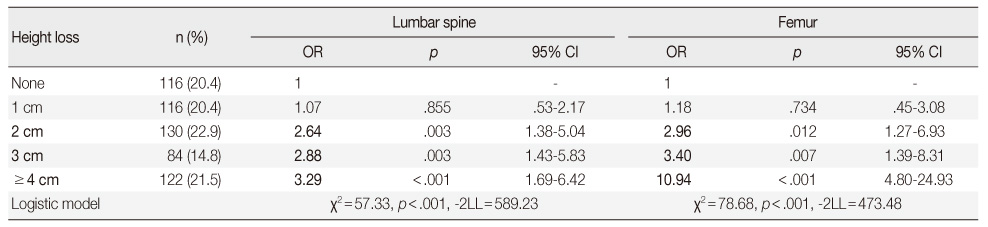
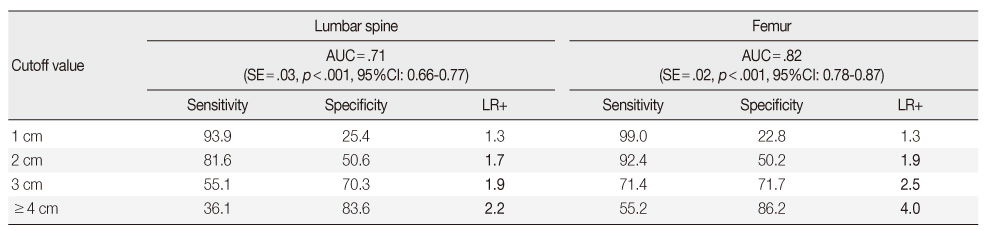
Figure & Data
REFERENCES
Citations
Citations to this article as recorded by 
- Age-Dependent Association of Height Loss with Incident Fracture Risk in Postmenopausal Korean Women
Chaewon Lee, Hye-Sun Park, Yumie Rhee, Namki Hong
Endocrinology and Metabolism.2023; 38(6): 669. CrossRef - CLINICAL EPIDEMIOLOGY OF OSTEOPOROSIS AMONG ELDERLY FISHING AND AGRICULTURAL POPULATION IN TAIPEI, TAIWAN
Journal of Men's Health.2020; 16(1): 53. CrossRef - Increased detection of genetic loci associated with risk predictors of osteoporotic fracture using a pleiotropic cFDR method
Jonathan Greenbaum, Kehao Wu, Lan Zhang, Hui Shen, Jigang Zhang, Hong-Wen Deng
Bone.2017; 99: 62. CrossRef - Systematic review and meta-analysis of the performance of clinical risk assessment instruments for screening for osteoporosis or low bone density
S. Nayak, D. L. Edwards, A. A. Saleh, S. L. Greenspan
Osteoporosis International.2015; 26(5): 1543. CrossRef - Texture analysis of mandibular cortical bone on digital dental panoramic radiographs for the diagnosis of osteoporosis in Korean women
Muthu Subash Kavitha, Seo-Young An, Chang-Hyeon An, Kyung-Hoe Huh, Won-Jin Yi, Min-Suk Heo, Sam-Sun Lee, Soon-Chul Choi
Oral Surgery, Oral Medicine, Oral Pathology and Oral Radiology.2015; 119(3): 346. CrossRef
 Cite
CiteUsefulness of Estimated Height Loss for Detection of Osteoporosis in Women
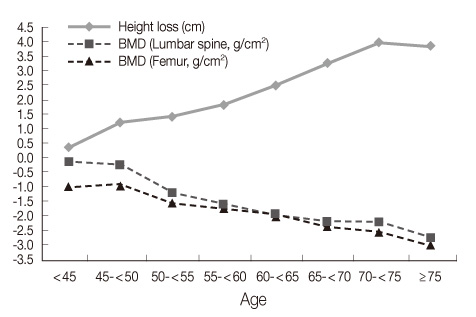

Figure 1
Bone mineral density and estimated height loss by age (N=732).
Bone mineral density (BMD) is significant different from the age (Lumbar spine: F=37.88, p<.001, Femur: F=54.27, p<.001); The correlation BMD and height loss is negatively significant (Lumbar spine: r=-.23, p<.001, Femur: r=-.34, p<.001).
Figure 2
Estimated height loss by bone mineral density (N=568).
T-score is absolute value (ex: l T-score l 2.5 → -2.5); Estimated height loss is significant different from T-score (Lumbar spine: F=4.60, p<.001; Femur: F=12.99, p<.001).
Figure 1
Figure 2
Usefulness of Estimated Height Loss for Detection of Osteoporosis in Women
Estimated Height Loss according to Relevant Characteristics (N=732)
*Mean±SE; †The BMI was adjusted to age; ‡Normal: T-score >-1.0; Osteopenia:-1.0≤T-score<-2.5; Osteoporosis: T-score≤-2.5.
Cut-off Values of Estimated Height Loss and Osteoporosis Prevalence (N=568)
CI=Confidence interval; OR (odds ratio) is exp (B) in the multiple regression model (reference level: T-score=-2.5).
ROC curves and Sensitivity, Specificity and Positive Likelihood Ratio of Estimated Height Loss
AUC=Area under curve; LR+=Positive likelihood ratio.
Table 1
Estimated Height Loss according to Relevant Characteristics (N=732)
*Mean±SE; †The BMI was adjusted to age; ‡Normal: T-score >-1.0; Osteopenia:-1.0≤T-score<-2.5; Osteoporosis: T-score≤-2.5.
Table 2
Cut-off Values of Estimated Height Loss and Osteoporosis Prevalence (N=568)
CI=Confidence interval; OR (odds ratio) is exp (B) in the multiple regression model (reference level: T-score=-2.5).
Table 3
ROC curves and Sensitivity, Specificity and Positive Likelihood Ratio of Estimated Height Loss
AUC=Area under curve; LR+=Positive likelihood ratio.

