Articles
- Page Path
- HOME > J Korean Acad Nurs > Volume 44(5); 2014 > Article
-
Original Article
- A Predictive Model of Fall Prevention Behaviors in Postmenopausal Women
- Hyun-Jung Jang1, Sukhee Ahn2
-
Journal of Korean Academy of Nursing 2014;44(5):525-533.
DOI: https://doi.org/10.4040/jkan.2014.44.5.525
Published online: October 15, 2014
1Department of Nursing, Kkottongnae University, Chungju
2College of Nursing, Chungnam National University, Daejeon, Korea
1Department of Nursing, Kkottongnae University, Chungju
2College of Nursing, Chungnam National University, Daejeon, Korea
- Address reprint requests to : Ahn, Sukhee College of Nursing, Chungnam National University, 266 Munwha-ro, Jung-gu, Daejeon 301-747, Korea Tel: +82-42-580-8324 Fax: +82-42-580-8309 E-mail: sukheeahn@cnu.ac.kr
Copyright © 2014 Korean Society of Nursing Science
This is an Open Access article distributed under the terms of the Creative Commons Attribution NoDerivs License. (http://creativecommons.org/licenses/by-nd/4.0) If the original work is properly cited and retained without any modification or reproduction, it can be used and re-distributed in any format and medium.
Abstract
-
Purpose
- This study was done to propose and test a predictive model that would explain and predict fall prevention behaviors in postmenopausal women. The health belief model was the theoretical basis to aid development of a nursing intervention fall prevention program.
-
Methods
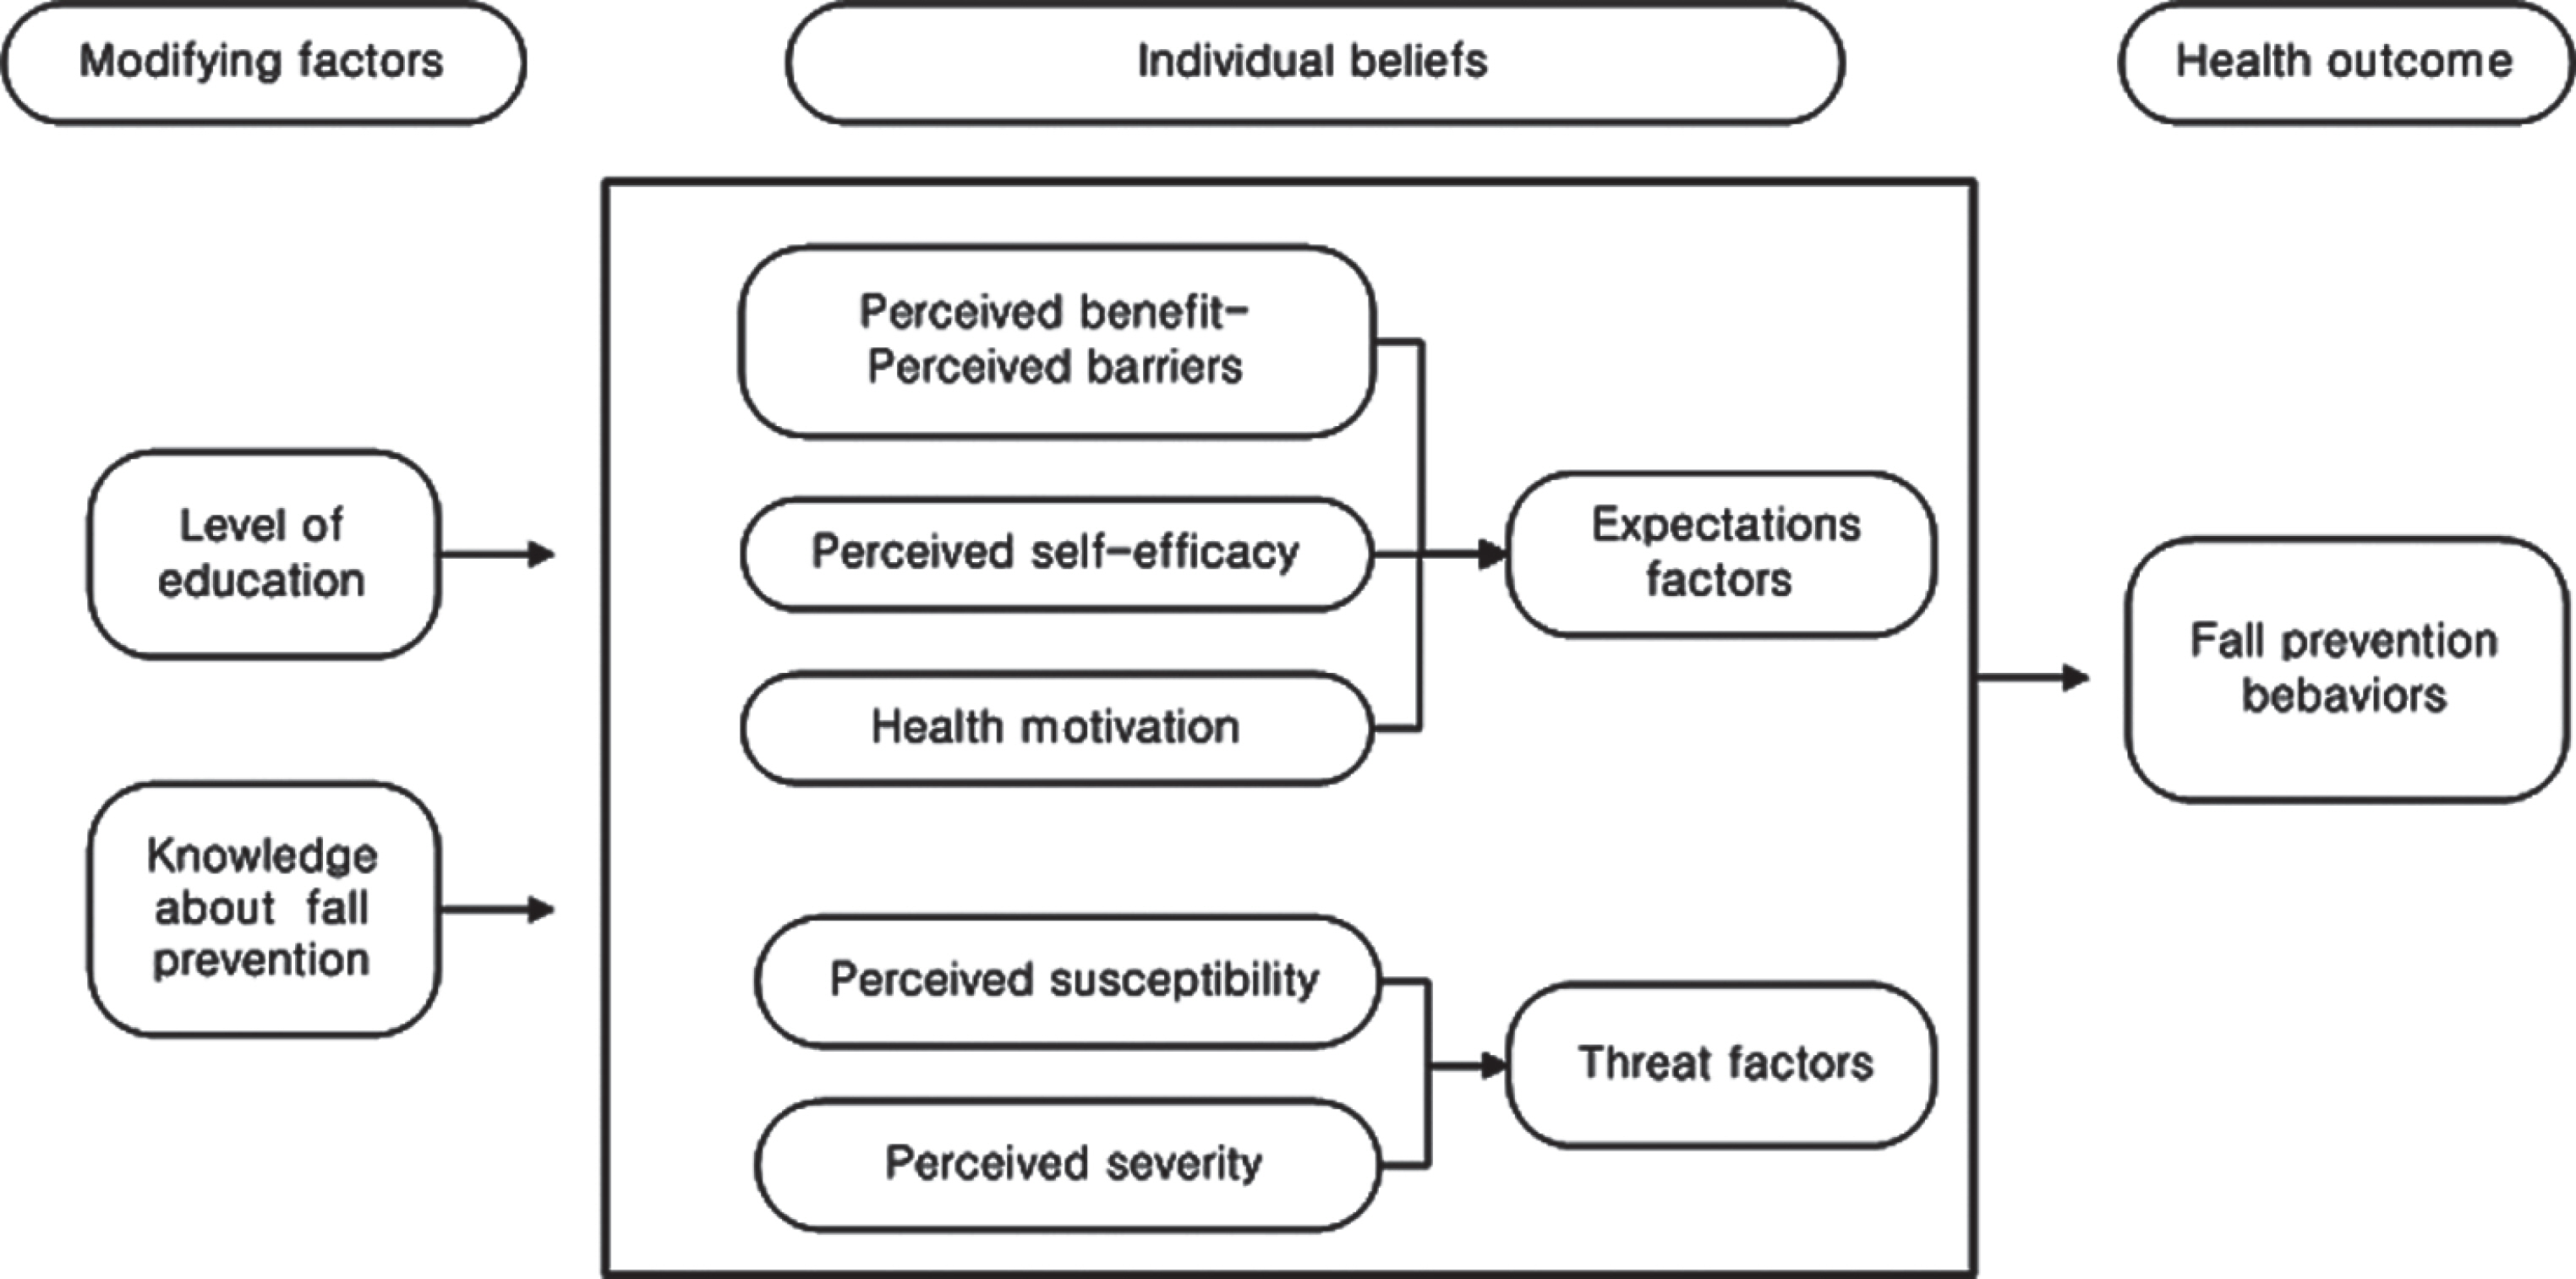
- Data for 421 postmenopausal women were selected from an original data set using a survey design. The structural equation model was tested for 3 constructs: modifying factors, expectation factors, and threat factors. Expectation factors were measured as relative perceived benefit (perceived benefit minus perceived barrier), self-efficacy, and health motivation; threat factors, as perceived susceptibility (fear of falling) and perceived severity (avoiding activity for fear of falling); and modifying factors: level of education and knowledge about fall prevention. Data were analyzed using SPSS Windows and AMOS program.
-
Results
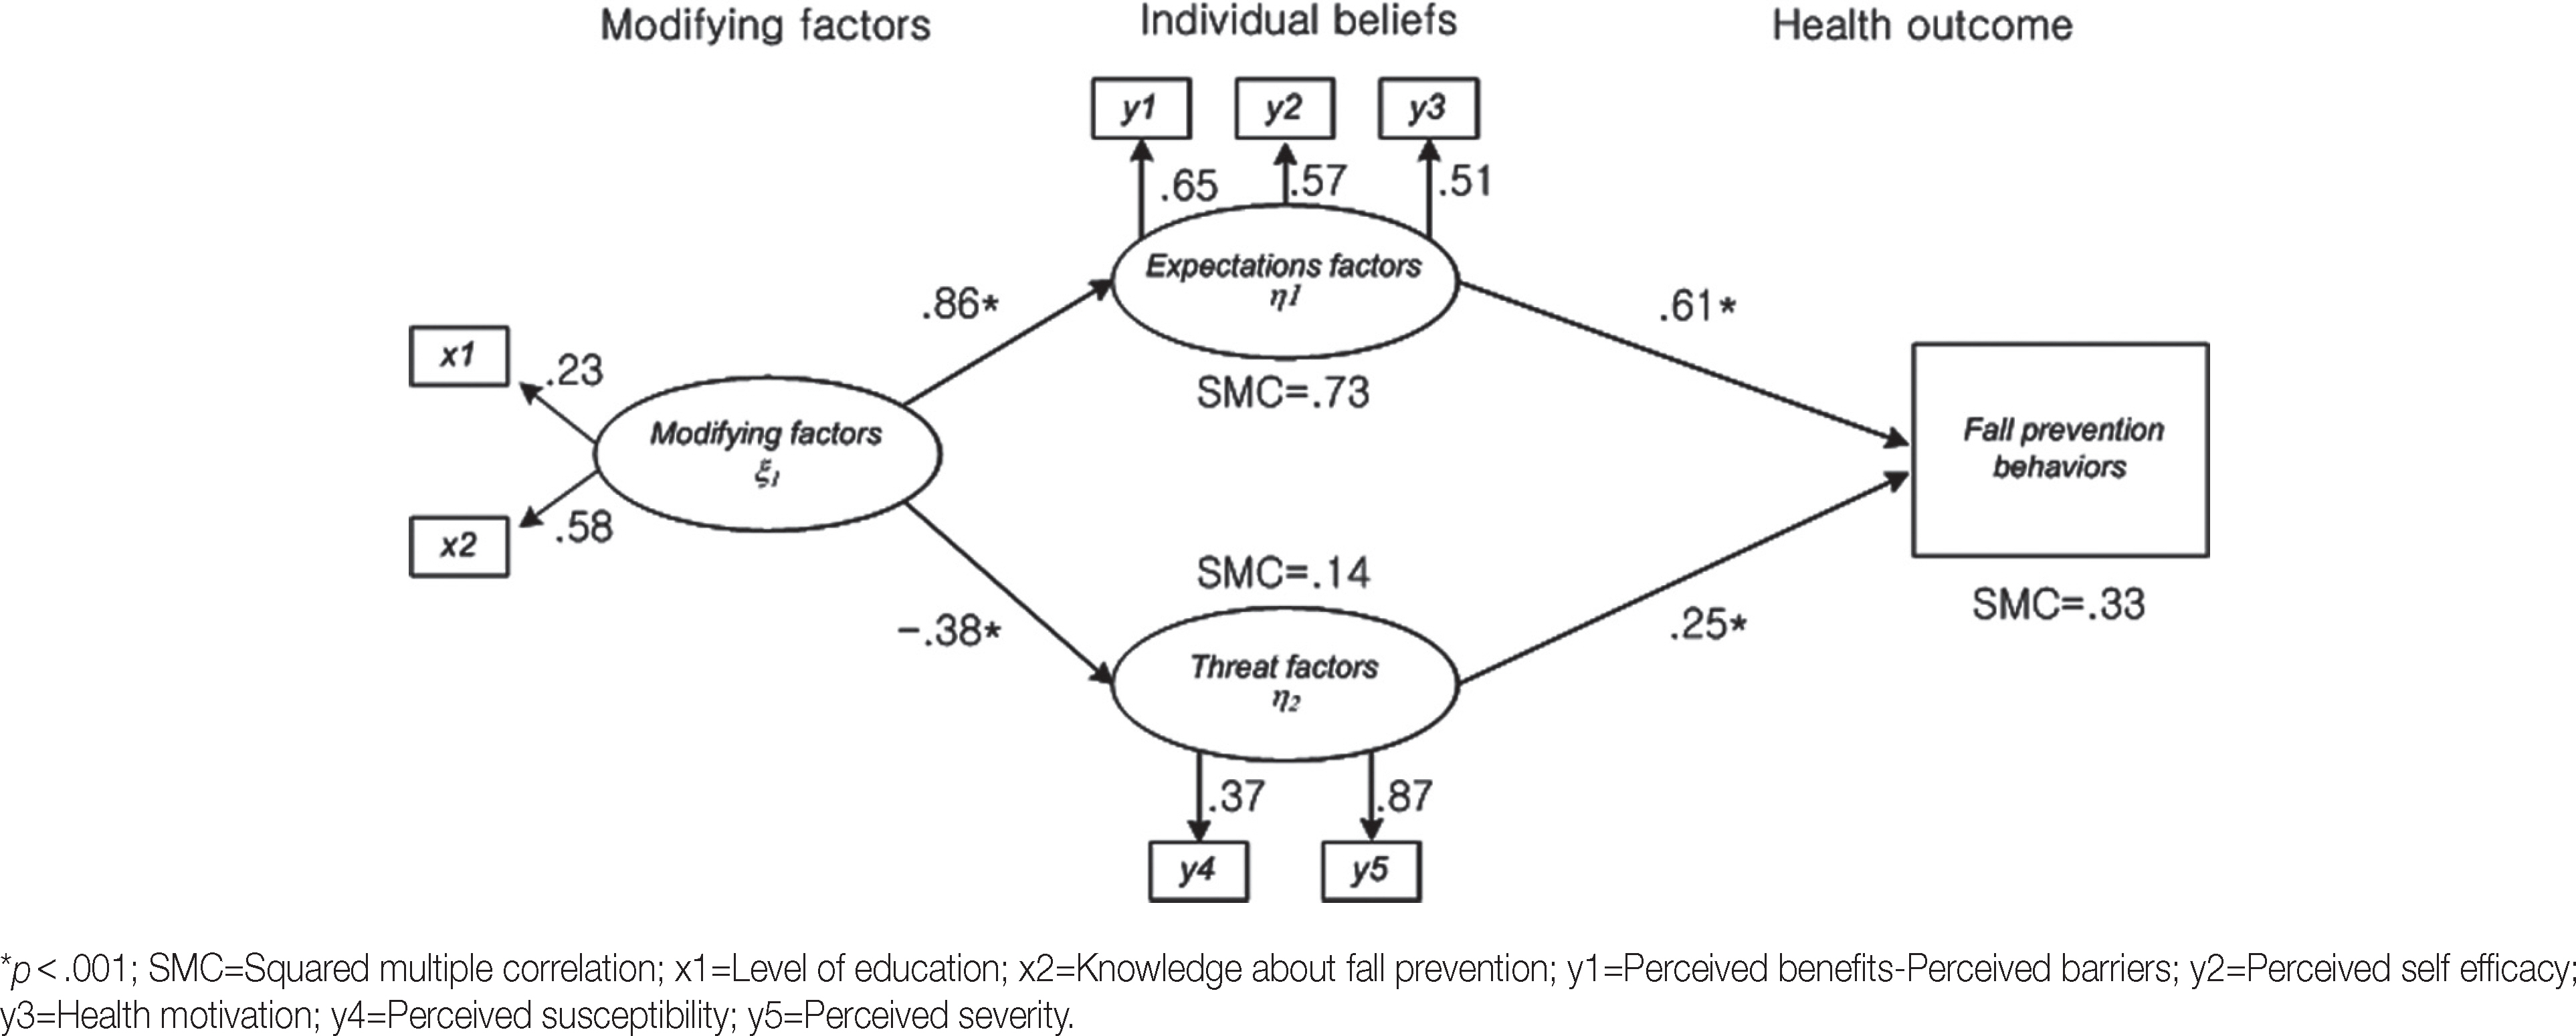
- Mean age was 55.7 years (range 45-64), and 19.7% had experienced a fall within the past year. Fall prevention behaviors were explained by expectation and threat factors indicating significant direct effects. Mediating effect of health beliefs was significant in the relationship between modifying factors and fall prevention behaviors. The proposed model explained 33% of the variance.
-
Conclusion
- Results indicate that fall prevention education should include knowledge, expectation, and threat factors based on health belief model.
- 1. International Osteoporosis Foundation. Osteoporosis & musculoskeletal disorders [Internet]. Nyon, CH: Author; 2011.[cited 2012 January 10]. Available from:. http://www.iofbonehealth.org/osteoporosis-musculoskeletal-disorders
- 2. Ministry of Health & Welfare, Korean Centers for Disease Control & Prevention. Korea health statistics 2008: Korea national health and nutrition examination survey. Cheongju: Korea Centers for Disease Control and Prevention; 2008.
- 3. Ahn S, Kim Y, Chun N, Lee SH. Incidence of osteoporosis and falls and predictors of fracture risk in postmenopausal women. Korean Journal of Women Health Nursing. 2012;18(4):237–247. http://dx.doi.org/10.4069/kjwhn.2012.18.4.237ArticlePubMed
- 4. Brenneman SK, Barrett-Connor E, Sajjan S, Markson LE, Siris ES. Impact of recent fracture on health-related quality of life in postmenopausal women. Journal of Bone and Mineral Research. 2006;21(6):809–816. http://dx.doi.org/10.1359/jbmr.060301ArticlePubMedPDF
- 5. Hill K, Schwarz J. Assessment and management of falls in older people. Internal Medicine Journal. 2004;34(9-10):557–564. http://dx.doi.org/10.1111/j.1445-5994.2004.00668.xArticlePubMed
- 6. Rubenstein LZ, Josephson KR. Falls and their prevention in elderly people: What does the evidence show? The Medical Clinics of North America. 2006;90(5):807–824. http://dx.doi.org/10.1016/j.mcna.2006.05.013ArticlePubMed
- 7. Gillespie LD, Robertson MC, Gillespie WJ, Sherrington C, Gates S, Clemson LM, et al. Interventions for preventing falls in older people living in the community. The Cochrane Database of Systematic Reviews. 2012;9:CD007146http://dx.doi.org/10.1002/14651858.CD007146.pub3Article
- 8. Moon ES, Lee ES. The relationship between knowledge, health beliefs, and prevention behaviors of osteoporotic fracture in patients receiving osteoporosis treatment. Korean Journal of Women Health Nursing. 2010;16(2):147–156. http://dx.doi.org/10.4069/kjwhn.2010.16.2.147ArticlePubMed
- 9. Doheny MO, Sedlak CA, Estok PJ, Zeller R. Osteoporosis knowledge, health beliefs, and DXA T-scores in men and women 50 years of age and older. Orthopaedic Nursing. 2007;26(4):243–250. http://dx.doi.org/10.1097/01.NOR.0000284654.68215.deArticlePubMed
- 10. Sedlak CA, Doheny MO, Estok PJ, Zeller RA, Winchell J. DXA, health beliefs, and osteoporosis prevention behaviors. Journal of Aging and Health. 2007;19(5):742–756. http://dx.doi.org/10.1177/0898264307304303ArticlePubMedPDF
- 11. Kwon MS. Relations among knowledge, fear and efficacy of fall in the community dwelling elderly. Journal of Korean Academy of Community Health Nursing. 2010;21(2):139–147. http://dx.doi.org/10.12799/jkachn.2010.21.2.139Article
- 12. Jung D. A prediction model of fear of falling in older adults living in a continuing-care retirement community (CCRC) in United States. Journal of the Korean Gerontological Society. 2009;29(1):243–258.
- 13. Chang CM, Kang HS. Physical function and psychological status in the elderly those who experienced a fall or not. The Korean Journal of Rehabilitation Nursing. 2004;7(1):48–57.
- 14. Rosenstock IM, Strecher VJ, Becker MH. Social learning theory and the health belief model. Health Education Quarterly. 1988;15(2):175–183.ArticlePubMedPDF
- 15. Champion VL, Skinner CS. The health belief model. In: Glanz K, Rimer BK, Viswanath K, editors. Health behavior and health education: Theory, research, and practice. 4th ed. San Francisco, CA: Jossey-Bass; 2008. p. 45–65.
- 16. Hur JY, Kim HJ. Relationship of risk factors, knowledge and attitude to falls in elderly inpatients. Journal of the Korean Gerontological Nursing. 2009;11(1):38–50.
- 17. Kempen GI, van Haastregt JC, McKee KJ, Delbaere K, Zijlstra GA. Socio-demographic, health-related and psychosocial correlates of fear of falling and avoidance of activity in community-living older persons who avoid activity due to fear of falling. BMC Public Health. 2009;9:170http://dx.doi.org/10.1186/1471-2458-9-170ArticlePubMedPMCPDF
- 18. Kim GS. Analysis structural equation modeling. Seoul: Hannarae Publishing Co.; 2010.
- 19. Currie L. Fall and injury prevention. In: Hughes RG, editor. Patient safety and quality: An evidence-based handbook for nurses. Rockville, MD: Agency for Healthcare Research and Quality (US); 2008.
- 20. Hur JH, Lim SK, Lee DH. Development of the Korean Falls Efficacy Scale (FES-K) for the elderly. The Korean Journal of Physical Education. 2010;49(3):193–201.
- 21. Ahn S. Osteoporosis and fall prevention project for postmenopausal women. Paper presented at: 2014 Aging in America Conference. 2014;March 11-15; Manchester Grand Hyatt, San Diego, CA.
- 22. Kim KK, Horan M, Gendler P, Patel MK. Osteoporosis health belief, self-efficacy, and knowledge tests. In: Redman BK, editor. Measurement tools in patient education. 2nd ed. New York, NY: Springer Publishing Company; 2003. p. 364–375.
- 23. Lee SH. Prediction model on osteoporosis prevention behavior in middle aged women [dissertation]. Seoul: Korea University; 2006.
- 24. Tideiksaar R. Falls in older people: Prevention and management. 3rd ed. Baltimore, MD: Health Professions Press; 2002.
- 25. Ahn S, Kim H, So H, Song R. Factors influencing fear of falling in post- menopausal women. Korean Journal of Women Health Nursing. 2009;15(4):344–352. http://dx.doi.org/10.4069/kjwhn.2009.15.4.344Article
- 26. Kim YH. Relations among fall efficacy, perception of fall risk and fall prevention behavior in the frail elderly at home. Journal of the Korea Academia-Industrial Cooperation Society. 2013;14(7):3383–3389.Article
- 27. Hwang SY, Shin SJ. Predictors of fall prevention behaviors in elderly inpatients. Korean Journal of Health Promotion. 2013;13(2):76–85.
- 28. Park YJ, Lee SJ, Shin NM, Kang HC, Kim SH, Kim T, et al. Structural model for osteoporosis preventive behaviors in postmenopausal women: Focused on their own BMD awareness. Korean Journal of Adult Nursing. 2013;25(5):527–538.ArticlePDF
- 29. Boo S. Body mass index and weight loss in overweight and obese Korean women: The mediating role of body weight perception. Asian Nursing Research. 2013;7(4):191–197.ArticlePubMed
REFERENCES
Figure & Data
REFERENCES
Citations

- Construction and validation of a nomogram for predicting fear of falling related activity restrictions in community-dwelling older adults
Yuxin Zhang, Rong Xue, Yuxiu Zhou, Yu Liu, Yumeng Li, Xiaoyue Zhang, Kaili Zhang
Geriatric Nursing.2024; 55: 286. CrossRef - Osteoporosis or fracture risk associated with thiazolidinedione and proton pump inhibitor co‐administration in patients with type 2 diabetes mellitus
Miyoung Ock, Sera Lee, Hyunah Kim
Journal of Clinical Pharmacy and Therapeutics.2022; 47(7): 1028. CrossRef - Associations between sleep duration, midday napping, depression, and falls among postmenopausal women in China: a population-based nationwide study
Zonglei Zhou, Yu Yu, Ruzhen Zhou, Rongsheng Luan, Kunpeng Li
Menopause.2021; 28(5): 554. CrossRef - Exploring Fear of Falling Related Activity Avoidance among Postmenopausal Women
Sukhee Ahn, Rhayun Song
International Journal of Environmental Research and Public Health.2021; 18(8): 4042. CrossRef - Effects of a health-belief-model-based osteoporosis- and fall-prevention program on women at early old age
Sukhee Ahn, Jiwon Oh
Applied Nursing Research.2021; 59: 151430. CrossRef - Identification of risk factors for falls in postmenopausal women: a systematic review and meta-analysis
J. Zhao, G. Liang, H. Huang, L. Zeng, W. Yang, J. Pan, J. Liu
Osteoporosis International.2020; 31(10): 1895. CrossRef - Structural Analysis of Variables related to Fall Prevention Behavior of Registered Nurses in Small-to-Medium Sized Hospitals
Ji Hyun Park, Jung Tae Son
Journal of Korean Academy of Fundamentals of Nursing.2018; 25(4): 269. CrossRef - Relationships among Knowledge, Self-efficacy, and Health Behavior of Osteoporosis and Fall Prevention in Old Aged Women
Sukhee Ahn, Jiwon Oh
Korean Journal of Women Health Nursing.2018; 24(2): 209. CrossRef - The Mediating Effect of Fall Risk Perception on the Relationship between Fracture Risk and Fall Prevention Behaviors in Women with Osteoporosis
Eun Nam Lee, Eun Jung Choi, Moon Jung Jang, Hyun Ju Hwang
Journal of muscle and joint health.2015; 22(2): 130. CrossRef - An Equation Model Development and Test based on Health Belief Model Regarding Osteoporosis Prevention Behaviors among Postmenopausal Women
Hyun-Jung Jang, Sukhee Ahn
Korean Journal of Adult Nursing.2015; 27(6): 624. CrossRef - A Structural Equation Model of Fall Prevention Behavior among Community-dwelling Older Adults with Osteoarthritis
Keong Sook Jang, Rhayun Song
Korean Journal of Adult Nursing.2015; 27(6): 684. CrossRef


Figure 1.
Figure 2.
| Variables | Categories (Range) | n (%) or M±SD | x1 |
x2 |
x3 |
y1 |
y2 |
y3 |
y4 |
y5 |
|---|---|---|---|---|---|---|---|---|---|---|
| r (p) | r (p) | r (p) | r (p) | r (p) | r (p) | r (p) | r (p) | |||
| x1 | ≤High school | 262 (62.2) | 1 | |||||||
| ≥College | 159 (37.8) | |||||||||
| x2 | (6-24) | 18.16±3.90 | .12 (.013) | 1 | ||||||
| x3 | Yes | 83 (19.7) | .04 | .06 | 1 | |||||
| No | 338 (80.3) | |||||||||
| y1 | (-11-16) | 2.53±4.72 | .10 (.041) | .27 (<.001) | .07 | 1 | ||||
| y2 | (7-35) | 26.43±4.73 | .06 | .39 | .04 | .37 | 1 | |||
| (<.001) | (<.001) | |||||||||
| y3 | (6-30) | 20.00±4.07 | .18 | .26 | −.01 | .33 | .33 | 1 | ||
| (<.001) | (<.001) | (<.001) | (<.001) | |||||||
| y4 | (1-4) | 1.96±0.71 | −.06 | −.03 | .09 | −.04 | −.10 | −.01 | 1 | |
| (.044) | ||||||||||
| y5 | (11-34) | 15.40±5.17 | −.17 | −.18 | .10 | −.15 | −.28 | −.07 | .32 | 1 |
| (<.001) | (<.001) | (.044) | (.002) | (<.001) | (<.001) | |||||
| y6 | (7-28) | 15.66±4.51 | .06 | .25 | .12 | .46 | .16 | .29 | .10 | .04 |
| (<.001) | (.018) | (<.001) | (.001) | (<.001) | (.036) |
| Endogenous variables | Exogenous variables | Direct effect |
Indirect effect |
Total effect |
SMC |
|---|---|---|---|---|---|
| ß (p) | ß (p) | ß (p) | |||
| Expectation factors | Modifying factors | .86 (<.001) | − | .86 | .73 |
| Threat factors | Modifying factors | −.38 (<.001) | − | −.38 | .14 |
| Fall prevention behaviors | Modifying factors | − | .43 (.022) | .43 | .33 |
| Expectation factors | .61 (<.001) | − | .63 | ||
| Threat factors | .25 (<.001) | − | .26 |
x1=Level of education (1=college and above); x2=Knowledge about fall prevention; x3=History of falls (1=yes); y1=Perceived benefits-barriers; y2=Perceived self-efficacy; y3=Health motivation; y4=Perceived susceptibility; y5=Perceived severity; y6=Fall prevention behaviors.
ß=Standardized coefficients; SMC=Squared multiple correlation.
 KSNS
KSNS
 E-SUBMISSION


 Cite
Cite

