Articles
- Page Path
- HOME > J Korean Acad Nurs > Volume 42(2); 2012 > Article
-
Original Article
- Accidental Mortality and Compensation Payment in School Activities among Elementary, Middle and High School Students in Seoul over Twenty Years (1988-2007)
- Sun Mi Shin, Hee Woo Lee
-
Journal of Korean Academy of Nursing 2012;42(2):248-257.
DOI: https://doi.org/10.4040/jkan.2012.42.2.248
Published online: April 30, 2012
1Full-time Instructor, Department of Nursing, Joongbu University, Chungnam, Korea.
2Deputy Director, Seoul Metropolitan Office of Education, Seoul, Korea.
- Address reprint requests to: Lee, Hee Woo. 408-506 Hyundai Apt. Seohyun-dong, Boondang-gu, Seongnam-city, Gyeonggi 463-777, Korea. Tel: +82-31-709-9333, 010-8736-5203, Fax: +82-41-750-6416, healthteam1@sen.go.kr
© 2012 Korean Society of Nursing Science
- 733 Views
- 0 Download
Abstract
-
Purpose
- The purpose of this study was to identify accidental mortality during school activities of students in elementary, middle or high school in Seoul and consequent compensation payment.
-
Methods
- Fifty-eight students died due to accidents during the period 1988 through 2007. Data were obtained from the Seoul School Safety and Insurance Association, and Seoul Metropolitan Office of Education. Chi-square, t test, and ANCOVA were used in the data analysis.
-
Results
- Among students, 75.9% were male and 37.9% were high school students. Accidental mortality was 1.61 per one million students (2.33 for male, and 0.82 for female students, and 0.93, 2.13 and 2.31 for elementary, middle and high school students, respectively). Mortality caused by drowning and falls per one million student was 0.85 and 0.74 for male, and 0.23 and 0.35 for female students. After age, year and cause were adjusted using ANCOVA, the mean compensation payment was 40,615 thousand won for male, and 62,000 thousands for female students. Highest compensation payment was 127,137 thousand for cerebral concussion after age, gender, year and cause were adjusted.
-
Conclusion
- To decrease student accidental mortality, especially drowning and falls, development of efficient safety-enforcing education is essential to prevent injuries and avoid preventable compensation costs.
- 1. Alexandrescu R., O'Brien S.J., Lecky F.E. A review of injury epidemiology in the UK and Europe: Some methodological considerations in constructing rates. BMC Public Health. 2009;9:226. http://dx.doi.org/10.1186/1471-2458-9-226.PubMedPMC
- 2. Chen R., Chen G., Song X.M., Zhang L., Zheng X.Y. Epidemiological study on disabilities among ethnic minorities in China. Zhonghua Liu Xing Bing Xue Za Zhi. 2010;31:538–543.PubMed
- 3. Conn J.M., Annest J.L., Gilchrist J. Sports and recreation related injury episodes in the US population, 1997-99. Injury Prevention. 2003;9:117–123. http://dx.doi.org/10.1136/ip.9.2.117.ArticlePubMedPMC
- 4. Danseco E.R., Miller T.R., Spicer R.S. Incidence and costs of 1987-1994 childhood injuries: Demographic breakdowns. Pediatrics. 2000;105:E27. ArticlePubMedPDF
- 5. Gallagher S.S., Finsison K., Guyer B., Goodenough S. The incidence of injuries among 87,000 Massachusetts children and adolescents: Results of the 1980-81 Statewide Childhood Injury Prevention Program Surveillance System. American Journal of Public Health. 1984;74:1340–1347.ArticlePubMedPMC
- 6. Hall J.R., Reyes H.M., Horvat M., Meller J.L., Stein R. The mortality of childhood falls. The Journal of Trauma. 1989;29:1273–1275.ArticlePubMed
- 7. Kim S.D. Epidemiology and control of injury. Journal of Preventive Medicine and Public Health. 2005;38(2):125–131.PubMed
- 8. Kim S.K., Yun D.J. Clinical observation on accidents for infant and childhood who visited the emergency room in the Wonju Christian Hospital from Kangwon area. Journal of the Korean Pediatric Society. 1981;24:957–967.
- 9. Kweon S.S., Shin M.H. An epidemiological study for child pedestrian traffic injuries that occurred in school-zone. Journal of Preventive Medicine and Public Health. 2005;38:163–169.PubMed
- 10. Lee J.H., Kim J.S., Shin D.G., Lee H.S. Statistical studies on pediatric emergency room patients. Journal of the Korean Pediatric Society. 1981;24:304–310.
- 11. Ljungberg E.M., Carlsson K.S., Dahlin L.B. Cost per case or total cost? The potential of prevention of hand injuries in young children-Retrospective and prospective studies. BMC Pediatrics. 2008;8(28):1–11. http://dx.doi.org/10.1186/1471-2431-8-28.PubMedPMC
- 12. Malek M., Chang B.H., Gallagher S.S., Guyer B. The cost of medical care for injuries to children. Annals of Emergency Medicine. 1991;20:997–1005. http://dx.doi.org/10.1016/S0196-0644(05)82979-8.ArticlePubMed
- 13. Owens P.L., Zodet M.W., Berdahl T., Dougherty D., McCormick M.C., Simpson L.A. Annual report on health care for children and youth in the United States: Focus on injury-related emergency department utilization and expenditures. Ambulatory Pediatrics. 2008;8(4):219–240. http://dx.doi.org/10.1016/j.ambp.2008.03.032.ArticlePubMed
- 14. Park J.H., Bae Y.S. Causes of childhood injuries observed at the emergency rooms of five hospitals in Taegu. Korean Journal of Preventive Medicine. 1988;21:224–237.
- 15. Park S.W., Heo Y.J., Lee S.W., Park J.H. Non-fatal injuries among preschool children in Daegu and Kyungpook. Journal of Preventive Medicine and Public Health. 2004;37:274–281.PubMed
- 16. Park T.J., Hyun S.R., Lee W.G., Moon S.J., Lee K.S. Clinical study of childhood accident. Journal of the Korean Pediatric Society. 1986;29(9):60–70.
- 17. Roberts I.G. International trends in pedestrian injury mortality. Archives of Disease in Childhood. 1993;68:190–192.ArticlePubMedPMC
- 18. Saari J. Stellman J.M. Accident prevention. In: Encyclopedia of occupational health and safety. 1998;Geneva, International Labour Office. 56.1–56.42.
- 19. Scheidt P.C., Harel Y., Trumble A.C., Jones D.H., Overpeck M.D., Bijur P.E. The epidemiology of nonfatal injuries among US children and youth. American Journal of Public Health. 1995;85:932–938.ArticlePubMedPMC
- 20. Statistical yearbook of Seoul education. Seoul Metropolitan Office of Education. 2011;Retrieved April 10, 2011. from http://statistics.sen.go.kr.
- 21. Shin K.S., Byun S.H., Rhee K.J., Kim S.J., Chung Y.H. Clinical analysis on accident of children. Journal of the Korean Pediatric Society. 1982;25:829–838.
- 22. Child death by injury, OECD comparison. Statistics Korea. Statistics Korea. 2009;Retrieved April 27, 2011. from http://kostat.go.kr/portal/korea/kor_nw/2/2/1/index.board.
- 23. Vyrostek S.B., Annest J.L., Ryan G.W. Surveillance for fatal and nonfatal injuries-United States, 2001. Morbidity and Mortality Weekly Report. Surveillance Summaries. 2004;53(7):1–57.
REFERENCES

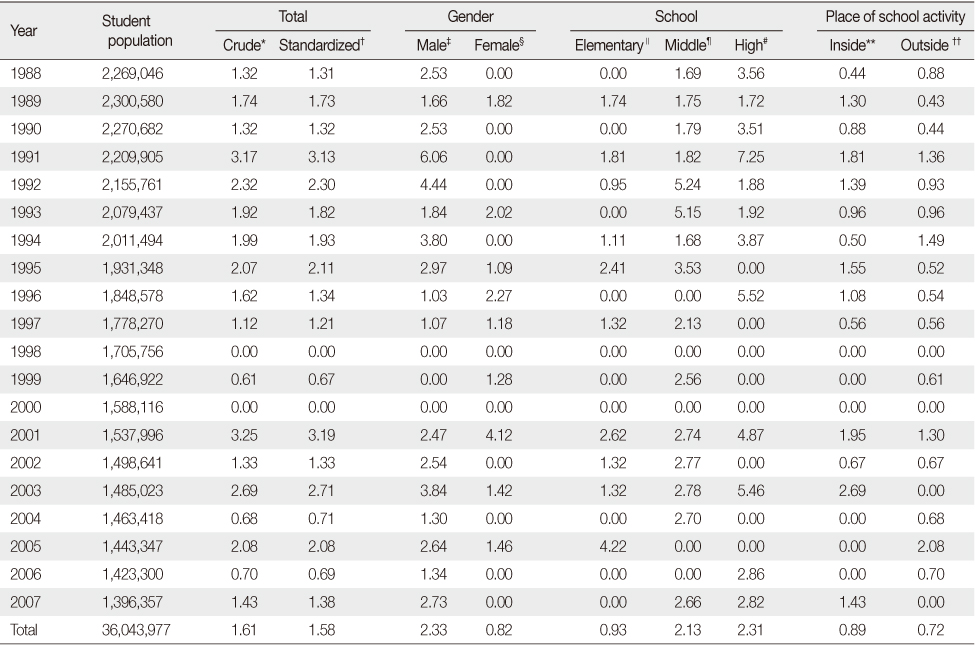
*(Number of students' accidental death÷student population)×1,000,000; †Standardized mortality based on elementary (49.27%), middle (26.27%), and high school student (24.46%) population in 2005; ‡(Number of male students' accidental death÷male student population)×1,000,000; §(Number of female students' accidental death÷female student population)×1,000,000; ∥(Number of accidental death among elementary school students÷elementary school student population)×1,000,000; ¶(Number of accidental death among middle school students÷middle school student population)×1,000,000; #(Number of accidental death among high school students÷high school student population)×1,000,000; **(Number of students' accidental death inside school÷student population)×1,000,000; ††(Number of students' accidental death outside school÷student population)×1,000,000.

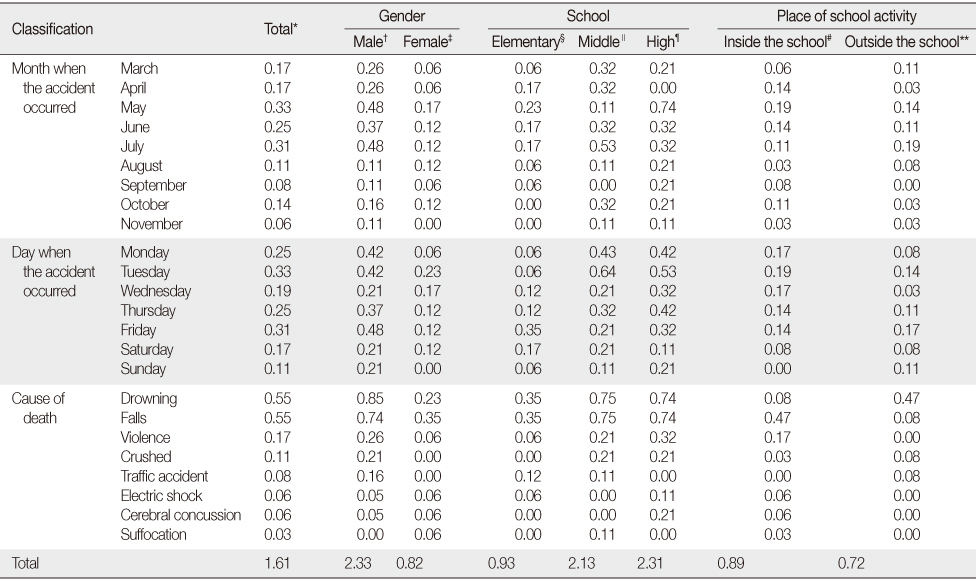
*(Number of students' accidental death÷student population)×1,000,000; †(Number of male students' accidental death÷male student population)×1,000,000; ‡(Number of female students' accidental death÷female student population)×1,000,000; §(Number of elementary school students' accidental death÷elementary school student population)×1,000,000; ∥(Number of middle school students' accidental death÷middle school student population)×1,000,000; ¶(Number of high school students' accidental death÷high school student population)×1,000,000; #(Number of students' accidental death inside school÷student population)×1,000,000; **(Number of students' accidental death outside school÷student population)×1,000,000.

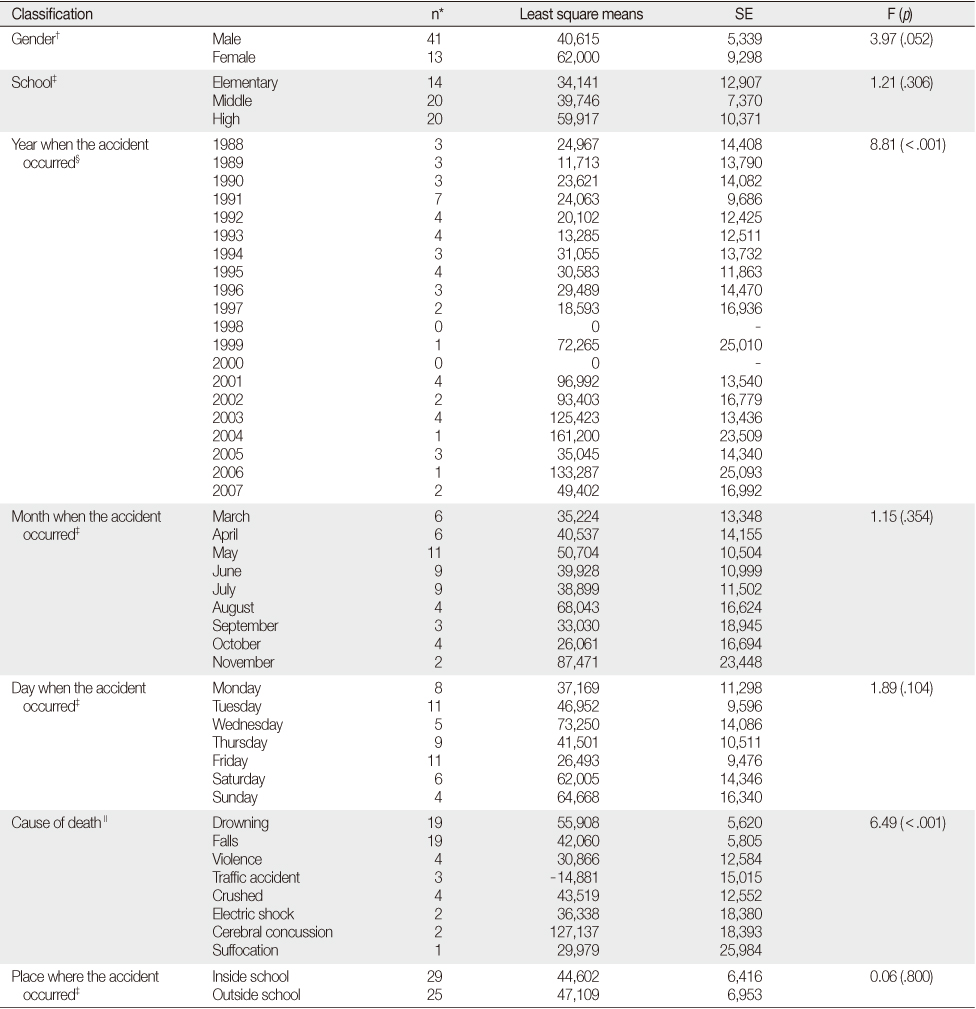
*Excluding 4 persons who were not eligible for compensation money; †Adjusting for age and significant covariates with ANOVA, 4 discrete years (1988-1992, 1993-1997, 1998-2002 and 2003-2007), type of death; ‡Adjusting for age, gender, 4 discrete years and type of death; §Adjusting for age, gender, type of death; ∥Adjusting for age, gender, 4 discrete years.
Figure & Data
REFERENCES
Citations

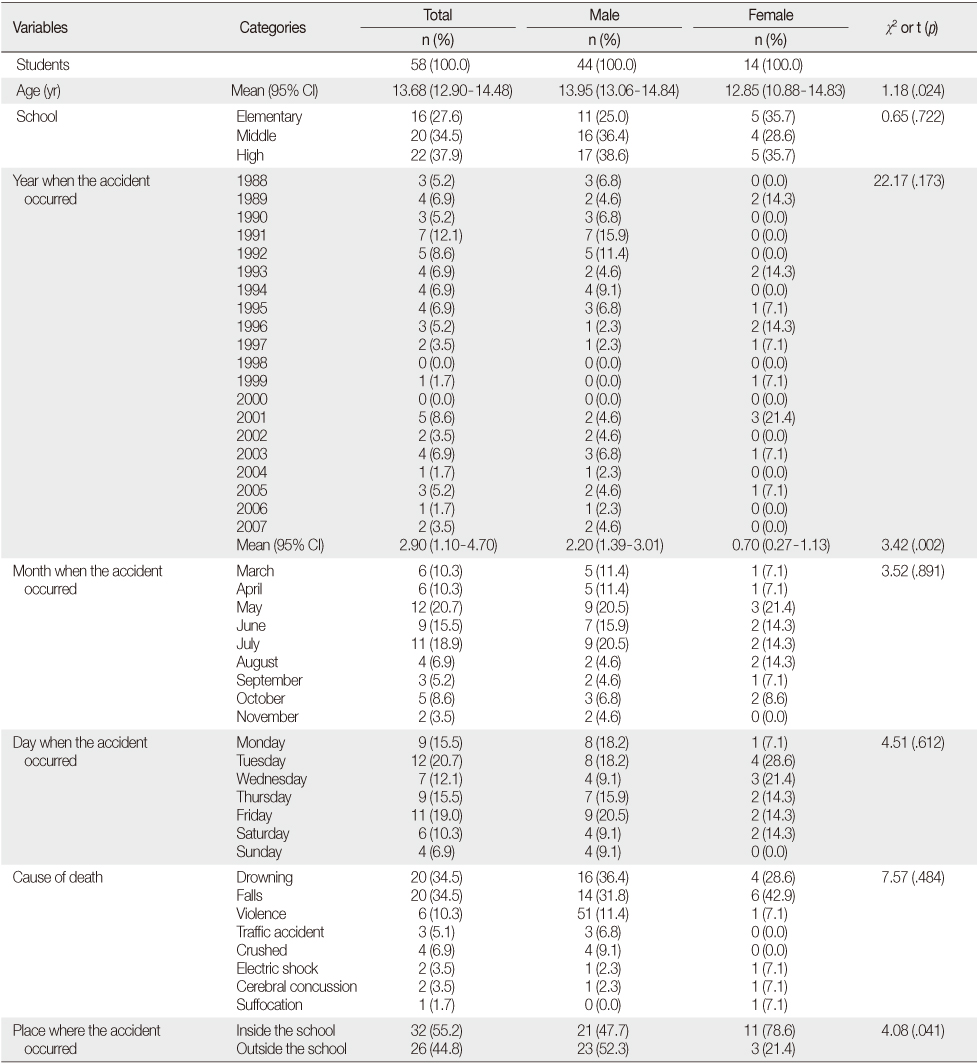
Distribution of Accidental Death in Students Over 20 Years in School
CI=Confidence interval.
Accidental Mortality per Million Students in School
*(Number of students' accidental death÷student population)×1,000,000; †Standardized mortality based on elementary (49.27%), middle (26.27%), and high school student (24.46%) population in 2005; ‡(Number of male students' accidental death÷male student population)×1,000,000; §(Number of female students' accidental death÷female student population)×1,000,000; ∥(Number of accidental death among elementary school students÷elementary school student population)×1,000,000; ¶(Number of accidental death among middle school students÷middle school student population)×1,000,000; #(Number of accidental death among high school students÷high school student population)×1,000,000; **(Number of students' accidental death inside school÷student population)×1,000,000; ††(Number of students' accidental death outside school÷student population)×1,000,000.
Accidental Mortality per Million Students by Month, Day, and Cause for 20 years
*(Number of students' accidental death÷student population)×1,000,000; †(Number of male students' accidental death÷male student population)×1,000,000; ‡(Number of female students' accidental death÷female student population)×1,000,000; §(Number of elementary school students' accidental death÷elementary school student population)×1,000,000; ∥(Number of middle school students' accidental death÷middle school student population)×1,000,000; ¶(Number of high school students' accidental death÷high school student population)×1,000,000; #(Number of students' accidental death inside school÷student population)×1,000,000; **(Number of students' accidental death outside school÷student population)×1,000,000.
Compensation Cost for Students' Accidental Death for 20 Years in School by ANCOVA (unit, 1,000 KRW)
*Excluding 4 persons who were not eligible for compensation money; †Adjusting for age and significant covariates with ANOVA, 4 discrete years (1988-1992, 1993-1997, 1998-2002 and 2003-2007), type of death; ‡Adjusting for age, gender, 4 discrete years and type of death; §Adjusting for age, gender, type of death; ∥Adjusting for age, gender, 4 discrete years.
CI=Confidence interval.
*(Number of students' accidental death÷student population)×1,000,000; †Standardized mortality based on elementary (49.27%), middle (26.27%), and high school student (24.46%) population in 2005; ‡(Number of male students' accidental death÷male student population)×1,000,000; §(Number of female students' accidental death÷female student population)×1,000,000; ∥(Number of accidental death among elementary school students÷elementary school student population)×1,000,000; ¶(Number of accidental death among middle school students÷middle school student population)×1,000,000; #(Number of accidental death among high school students÷high school student population)×1,000,000; **(Number of students' accidental death inside school÷student population)×1,000,000; ††(Number of students' accidental death outside school÷student population)×1,000,000.
*(Number of students' accidental death÷student population)×1,000,000; †(Number of male students' accidental death÷male student population)×1,000,000; ‡(Number of female students' accidental death÷female student population)×1,000,000; §(Number of elementary school students' accidental death÷elementary school student population)×1,000,000; ∥(Number of middle school students' accidental death÷middle school student population)×1,000,000; ¶(Number of high school students' accidental death÷high school student population)×1,000,000; #(Number of students' accidental death inside school÷student population)×1,000,000; **(Number of students' accidental death outside school÷student population)×1,000,000.
*Excluding 4 persons who were not eligible for compensation money; †Adjusting for age and significant covariates with ANOVA, 4 discrete years (1988-1992, 1993-1997, 1998-2002 and 2003-2007), type of death; ‡Adjusting for age, gender, 4 discrete years and type of death; §Adjusting for age, gender, type of death; ∥Adjusting for age, gender, 4 discrete years.
 KSNS
KSNS
 E-SUBMISSION

 Cite
Cite

